Fig. 8
Download original image
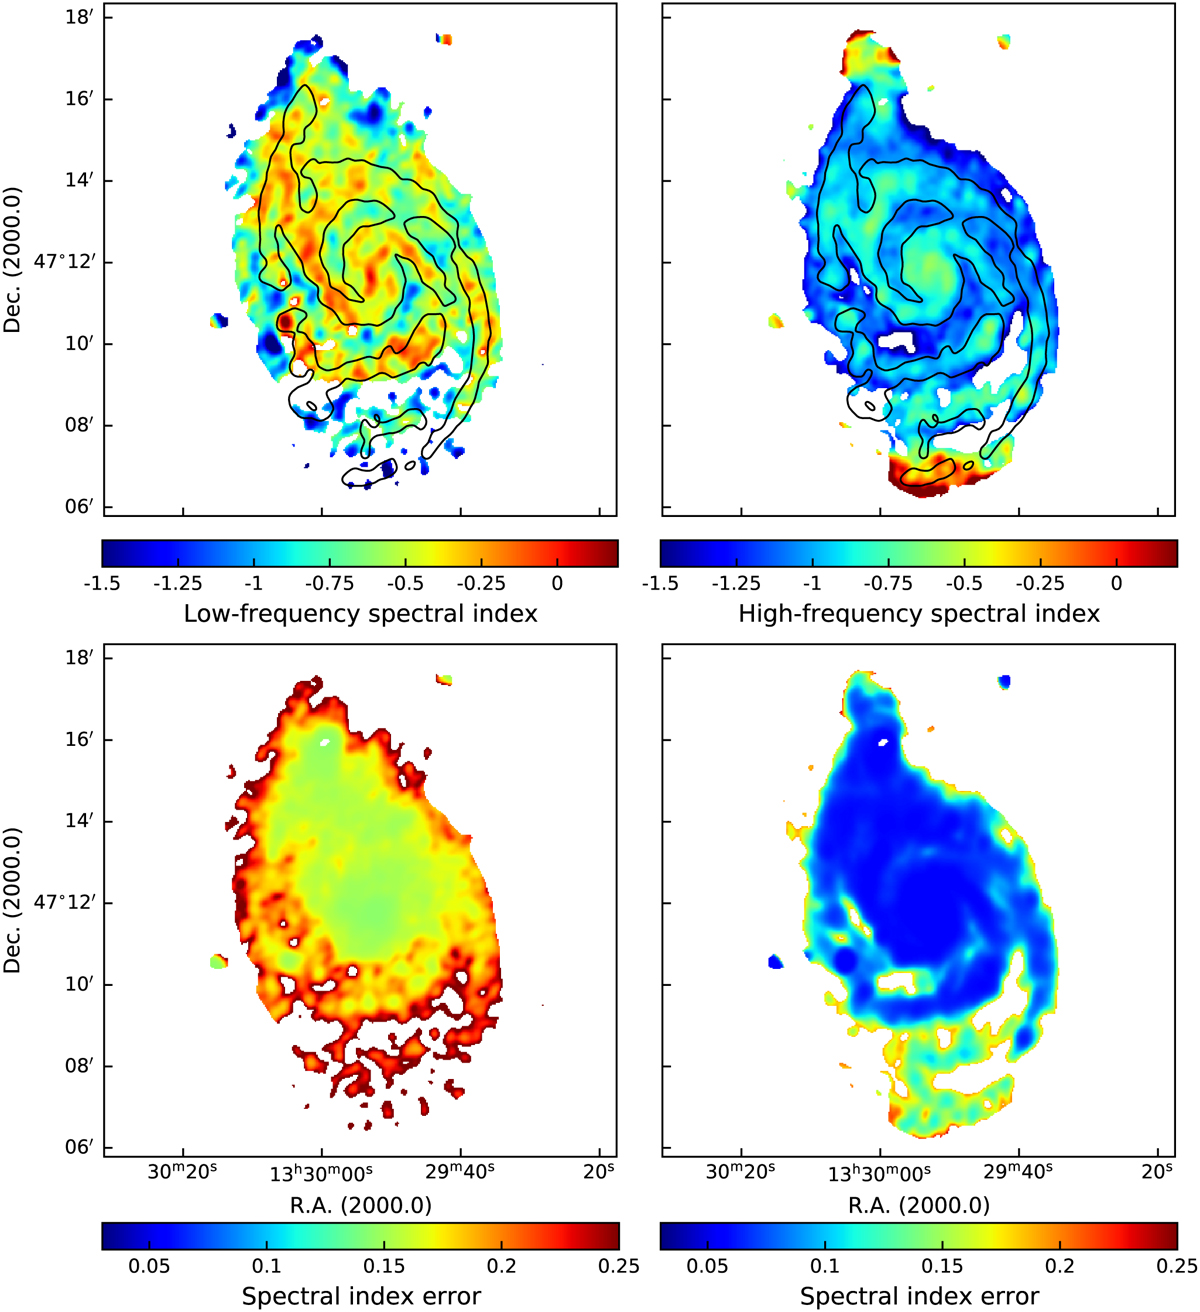
Two point non-thermal radio spectral indices at low (θlow; 54–144 MHz) and high (θhigh; 1370–4850 MHz) frequencies. The top panels show the spectral indices θlow (left panel) and at θhigh (right panel). The bottom panels show the corresponding uncertainty maps. The black contours represent a total gas-mass surface density 25 M⊙ pc−2.
Current usage metrics show cumulative count of Article Views (full-text article views including HTML views, PDF and ePub downloads, according to the available data) and Abstracts Views on Vision4Press platform.
Data correspond to usage on the plateform after 2015. The current usage metrics is available 48-96 hours after online publication and is updated daily on week days.
Initial download of the metrics may take a while.