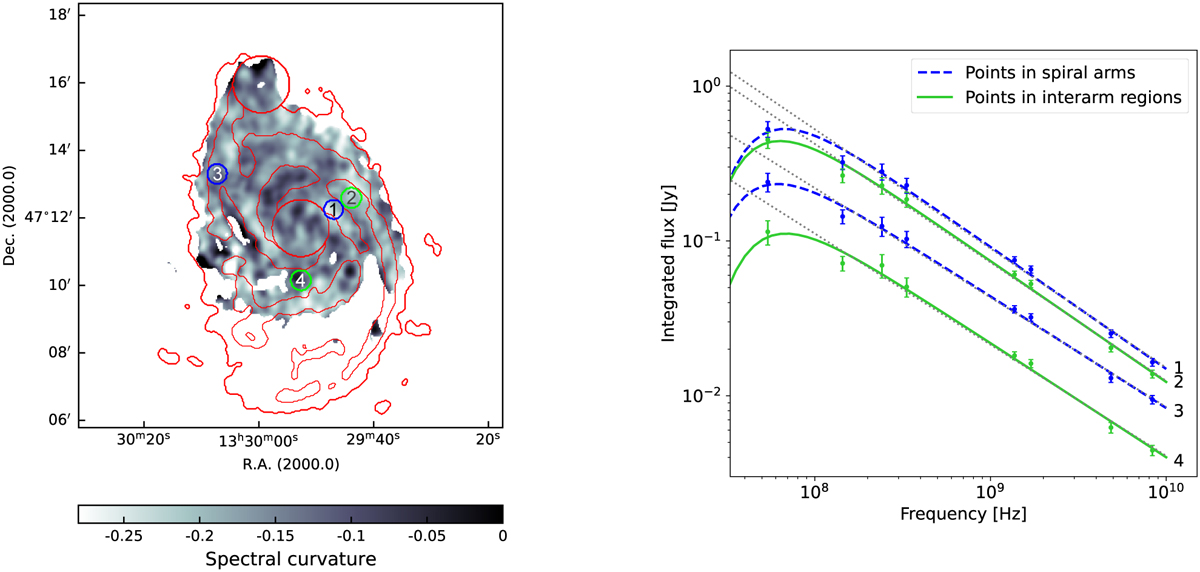
Fig. B.1
Download original image
Individual point spectra. Left panel: The location of individual spectra from spiral arms (inter-arm regions) marked by green (blue) circles on top of the spectral curvature map. The size of the circles corresponds to the beam size. Red contours at the total gas-mass density of 8 and 25 M⊙ pc−2 define the borders of the spiral arm and inter-arm regions, respectively (Sec. 3.3). Right panel: Non-thermal radio continuum spectra for representative beam-sized regions marked in the left panel. Each spectrum is labeled with its corresponding number. Dotted lines show the power-law fits for frequencies ≥144 MHz. The individual spectra show the same trends as the integrated spectra in Fig. 9.
Current usage metrics show cumulative count of Article Views (full-text article views including HTML views, PDF and ePub downloads, according to the available data) and Abstracts Views on Vision4Press platform.
Data correspond to usage on the plateform after 2015. The current usage metrics is available 48-96 hours after online publication and is updated daily on week days.
Initial download of the metrics may take a while.