Fig. 10
Download original image
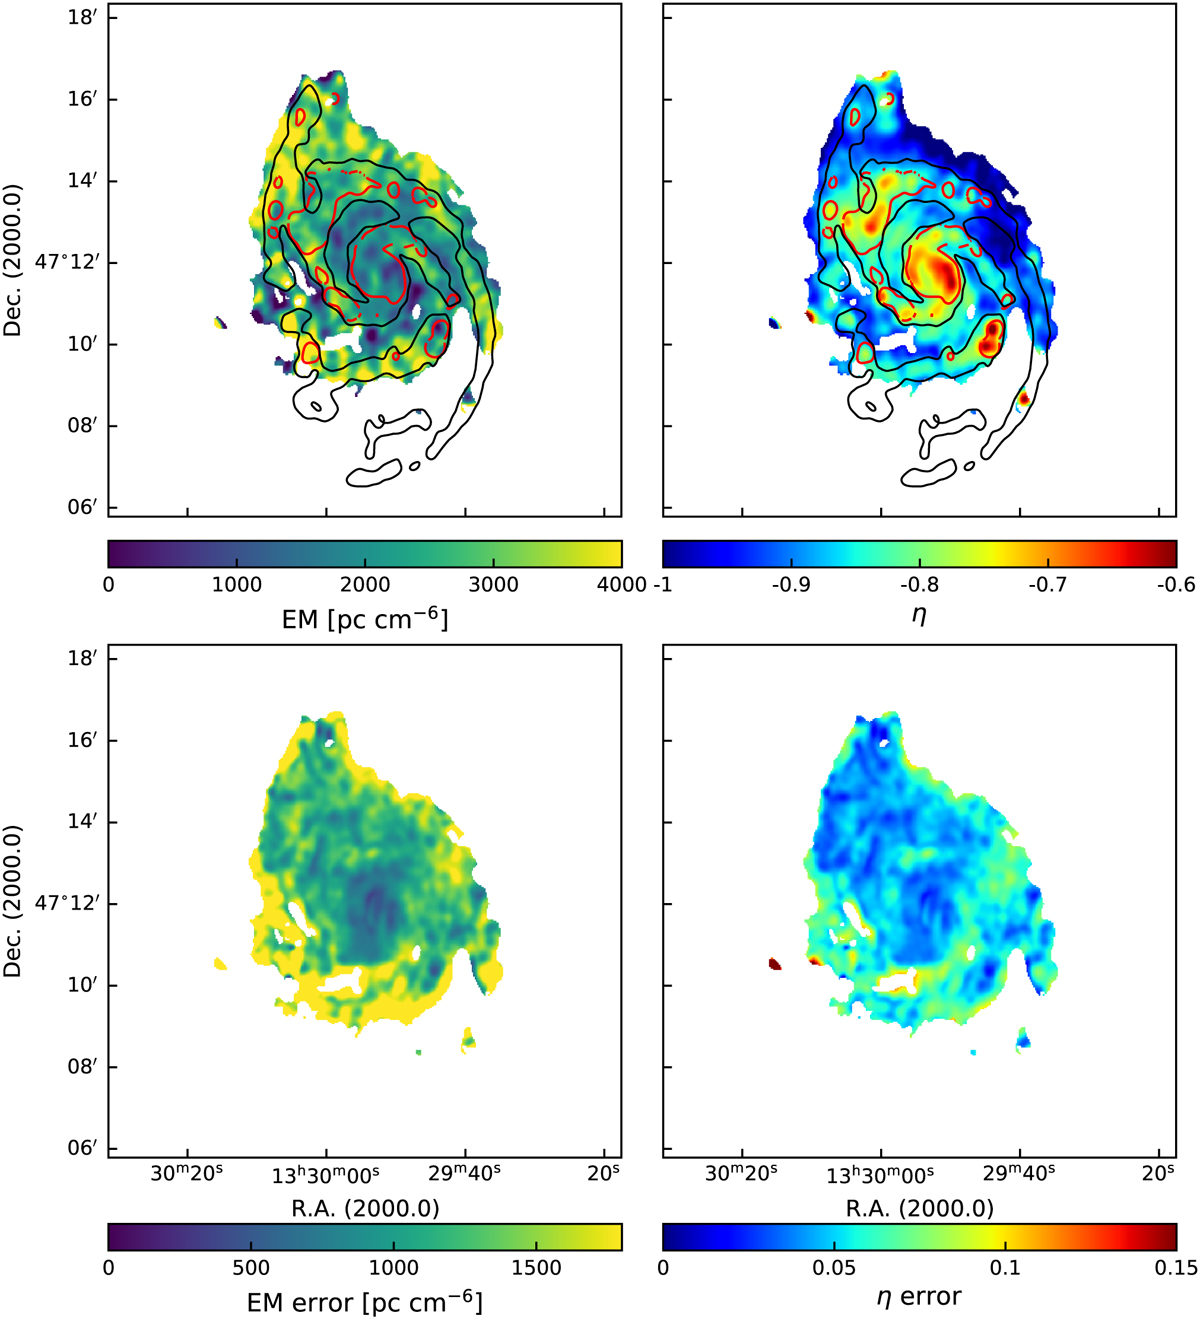
Thermal free–free absorption. Results from fitting the thermal absorption model to the non-thermal radio continuum emission at eight frequencies between 45 and 8350 MHz (Table 2). The left column shows the resulting EM map (top panel) and its uncertainty map (bottom panel). The right column shows the radio spectral index of the optically thin medium H (top panel) and its uncertainty map (bottom panel). The red contours represent the Hα flux value of 2.6 × 10⁻¹³ erg s−1 cm−2 $Aring;−1 beam−1 from the Metal-THINGS survey. The black contours represent a total gas-mass surface density 25 M⊙ pc−2.
Current usage metrics show cumulative count of Article Views (full-text article views including HTML views, PDF and ePub downloads, according to the available data) and Abstracts Views on Vision4Press platform.
Data correspond to usage on the plateform after 2015. The current usage metrics is available 48-96 hours after online publication and is updated daily on week days.
Initial download of the metrics may take a while.