Fig. 3.
Download original image
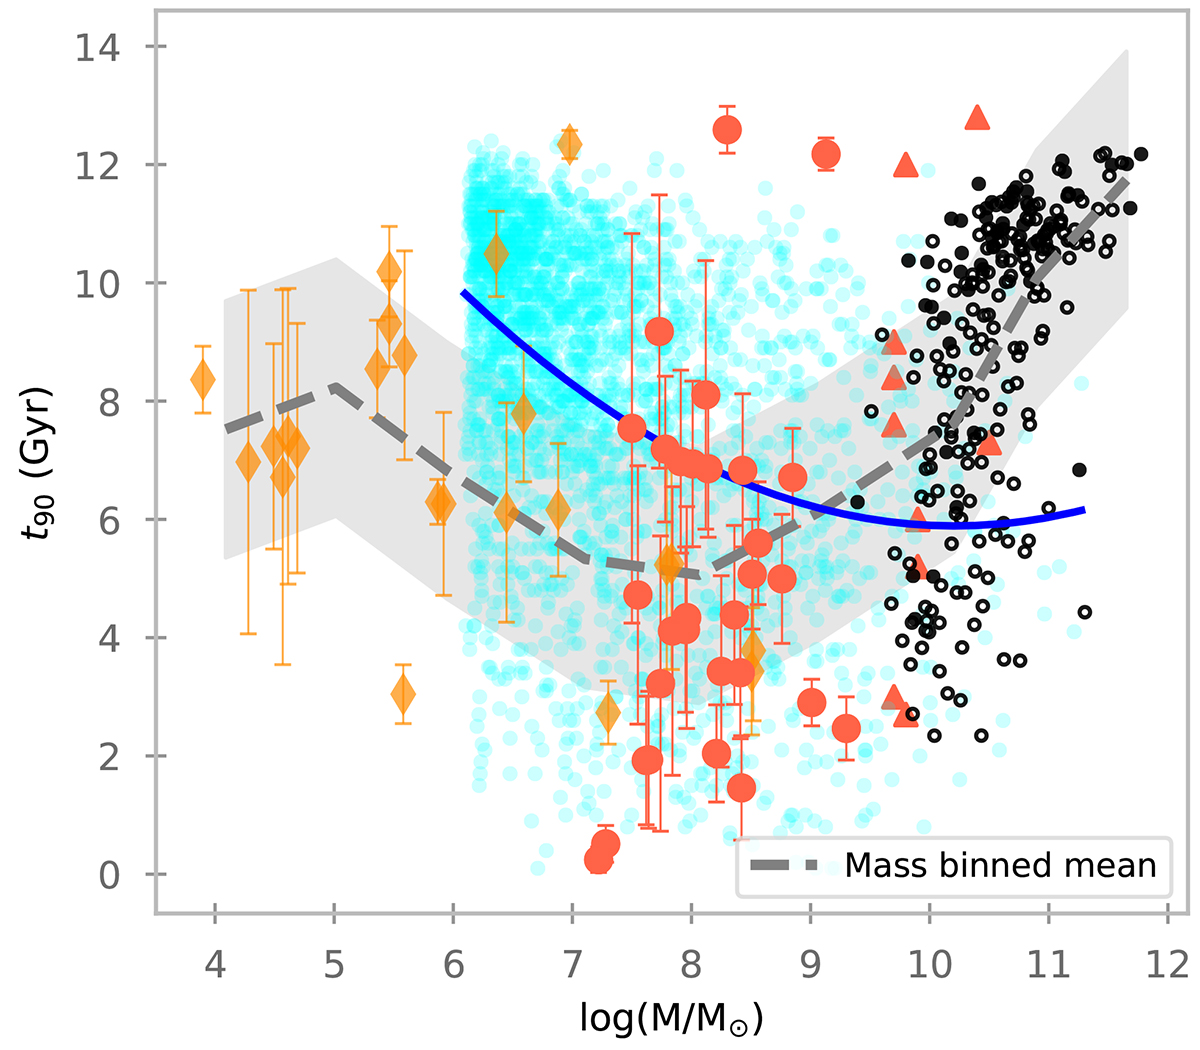
Figure showing the relation between t90 and stellar mass, as presented in Paper IV. The orange diamonds are dwarf galaxy satellites of the Milky Way or Andromeda; these galaxies are included in the plot simply to show how the U-shape continues for less massive galaxies. The red circles are the dwarfs from the SAMI-Fornax sample. The giant galaxies from the ATLAS3D project are represented by empty or filled black dots depending on whether they are in the field or a cluster, respectively. In addition to the figure in Paper IV, we have added the Fornax3D galaxies as red triangles. For all the observed galaxies, we include the mass-binned mean of t90 with a dashed grey line and a grey shadow shows the standard deviation. The simulated galaxies from IllustrisTNG (https://www.tng-project.org/) are the cyan points, while the blue line is the mass-binned mean of these galaxies.
Current usage metrics show cumulative count of Article Views (full-text article views including HTML views, PDF and ePub downloads, according to the available data) and Abstracts Views on Vision4Press platform.
Data correspond to usage on the plateform after 2015. The current usage metrics is available 48-96 hours after online publication and is updated daily on week days.
Initial download of the metrics may take a while.