Fig. 1.
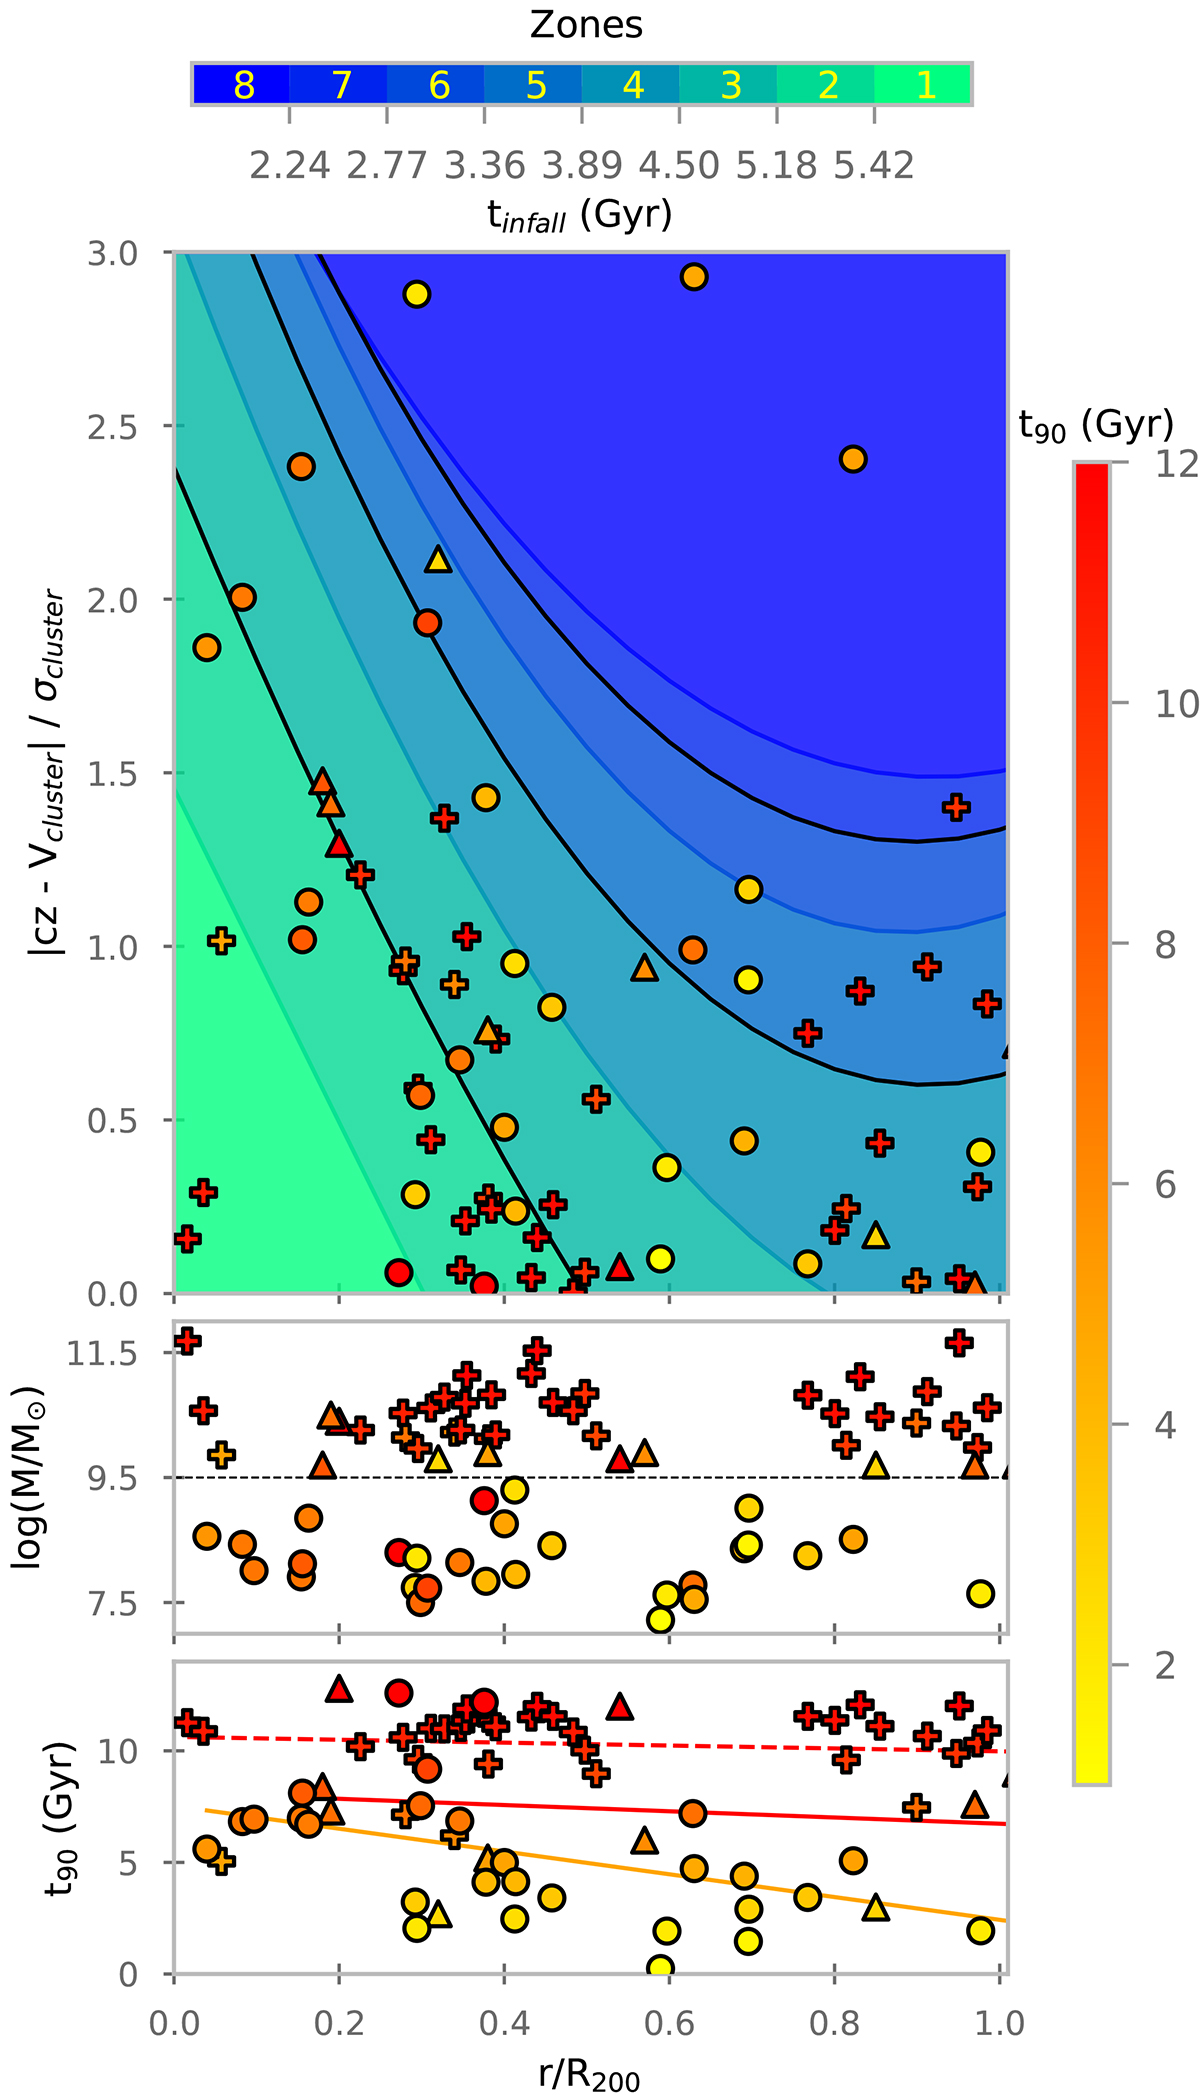
Download original image
Plots showing the distribution of the galaxies in the phase space, and some of their properties. The top panel shows the phase space for the SAMI-Fornax, ATLAS3D, and Fornax3D samples. This phase space is divided into eight different zones – according to Pasquali et al. (2019) – that represent the infall time of the galaxies in those zones. For a better contrast, we marked zones 2, 4, and 6 with black lines. From green to blue, the infall times in Gyr change according to the top colour bar. The middle panel shows the stellar mass of the galaxies as a function of projected distance, with a horizontal black dashed line that separates the Fornax’s dwarfs from the rest of the galaxies. In the bottom panel, we present the t90 of the galaxies as a function of projected distance, with a dashed red line fitting the trend for giants of Virgo, a red line for the Fornax3D galaxies, and an orange line fitting the trend for dwarfs. These relations of t90 with the environment were highlighted in Paper IV. In all panels, we show the SAMI-Fornax dwarfs with circles, while the massive galaxies for Virgo and Fornax are marked with crosses and triangles, respectively. All symbols are coloured with t90, the value of which is indicated by the vertical colour bar.
Current usage metrics show cumulative count of Article Views (full-text article views including HTML views, PDF and ePub downloads, according to the available data) and Abstracts Views on Vision4Press platform.
Data correspond to usage on the plateform after 2015. The current usage metrics is available 48-96 hours after online publication and is updated daily on week days.
Initial download of the metrics may take a while.