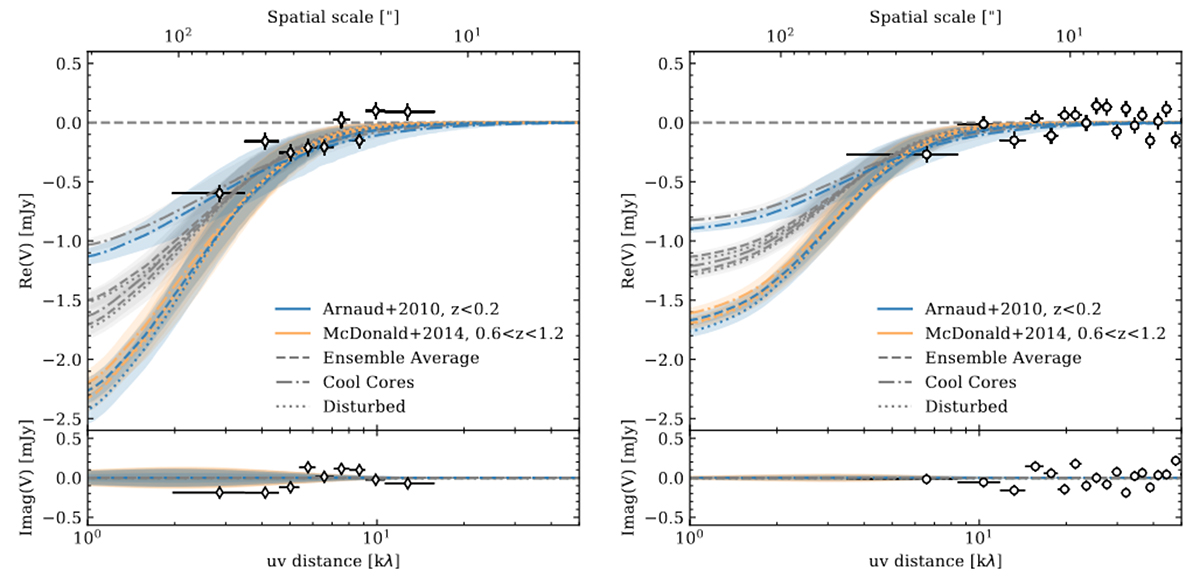
Fig. 9.
Download original image
Same as Figure 6 (also shown here in gray), but including here the additional constraining power of the ACT data in the model fitting. We observe a tighter correlation at smaller uv-distances, an overall larger amplitude, and a smaller eccentricity. We note the ACT data are not shown due to the complexity of accurately representing the image space data in this domain.
Current usage metrics show cumulative count of Article Views (full-text article views including HTML views, PDF and ePub downloads, according to the available data) and Abstracts Views on Vision4Press platform.
Data correspond to usage on the plateform after 2015. The current usage metrics is available 48-96 hours after online publication and is updated daily on week days.
Initial download of the metrics may take a while.