Fig. 8.
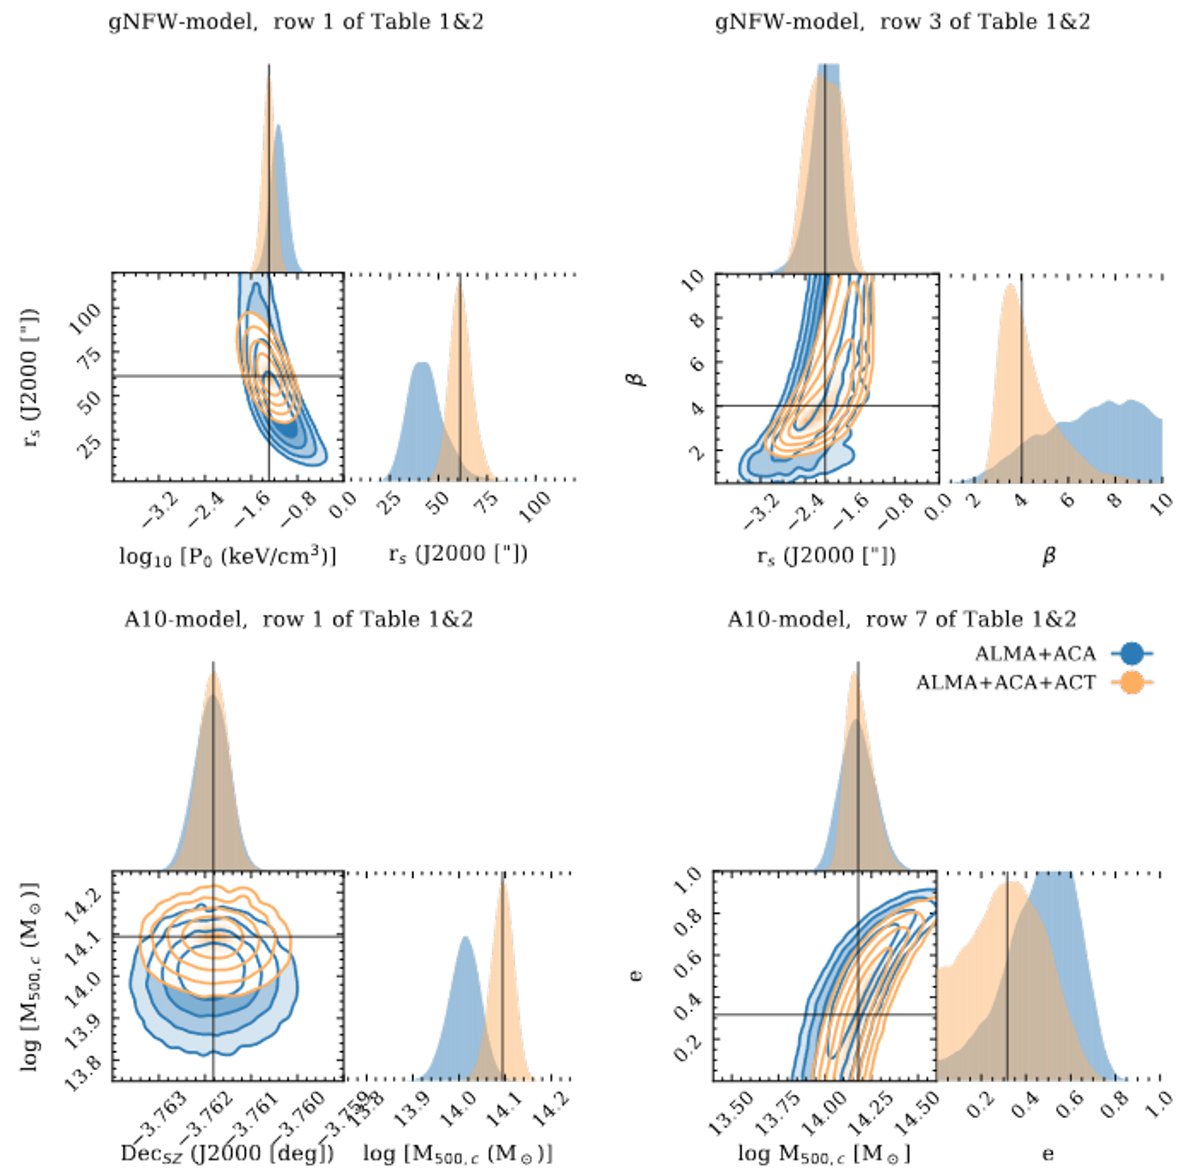
Download original image
Comparison between modeling with ALMA+ACA (blue) and ALMA+ACA+ACT (orange) observations. The full posterior distributions of all runs can be found in the supplementary material. Here we highlight four marginalized posterior distributions to show the effect ACT observations have on the P0 − rs, rs − β, Dec–M500, c, and the M500, c − e relationships, shown from left to right, top to bottom. The weighted median values of the ALMA+ACA+ACT runs are highlighted with black lines. For a detailed description of the effect the ACT observations have on the sampled posterior distribution, we refer to the text in Section 5.2.
Current usage metrics show cumulative count of Article Views (full-text article views including HTML views, PDF and ePub downloads, according to the available data) and Abstracts Views on Vision4Press platform.
Data correspond to usage on the plateform after 2015. The current usage metrics is available 48-96 hours after online publication and is updated daily on week days.
Initial download of the metrics may take a while.