Fig. 5.
Download original image
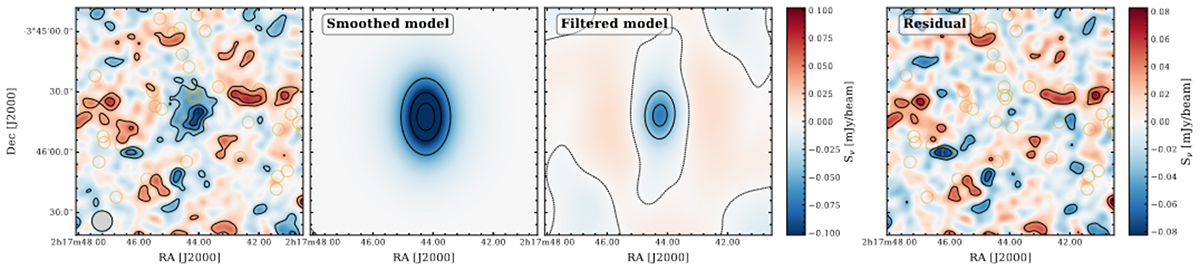
Most likely model from the theoretical formalism (based on the Bayes factor, row 5) of Table 1. In the left panel, we show the dirty image of the joined ACA+ALMA observations. The second panel is the likelihood-weighted model reconstruction from the nested sampling routine. The third panel shows the model corrected for the incomplete uv-coverage of the observations. On the right, we show the residuals by subtracting the model from the observed visibilities. The black contours are drawn at [−4.5, −3.5, −2.5, −1.5, 1.5, 2.5, 3.5]-σ based on the noise in the residual map. The third panel also includes the 0σ level. The contours in the second panel are drawn at [−6.5, −4.5, −2.5, 2.5, 3.5]-σ. The model shows a clear resemblance to the data.
Current usage metrics show cumulative count of Article Views (full-text article views including HTML views, PDF and ePub downloads, according to the available data) and Abstracts Views on Vision4Press platform.
Data correspond to usage on the plateform after 2015. The current usage metrics is available 48-96 hours after online publication and is updated daily on week days.
Initial download of the metrics may take a while.