Fig. 3.
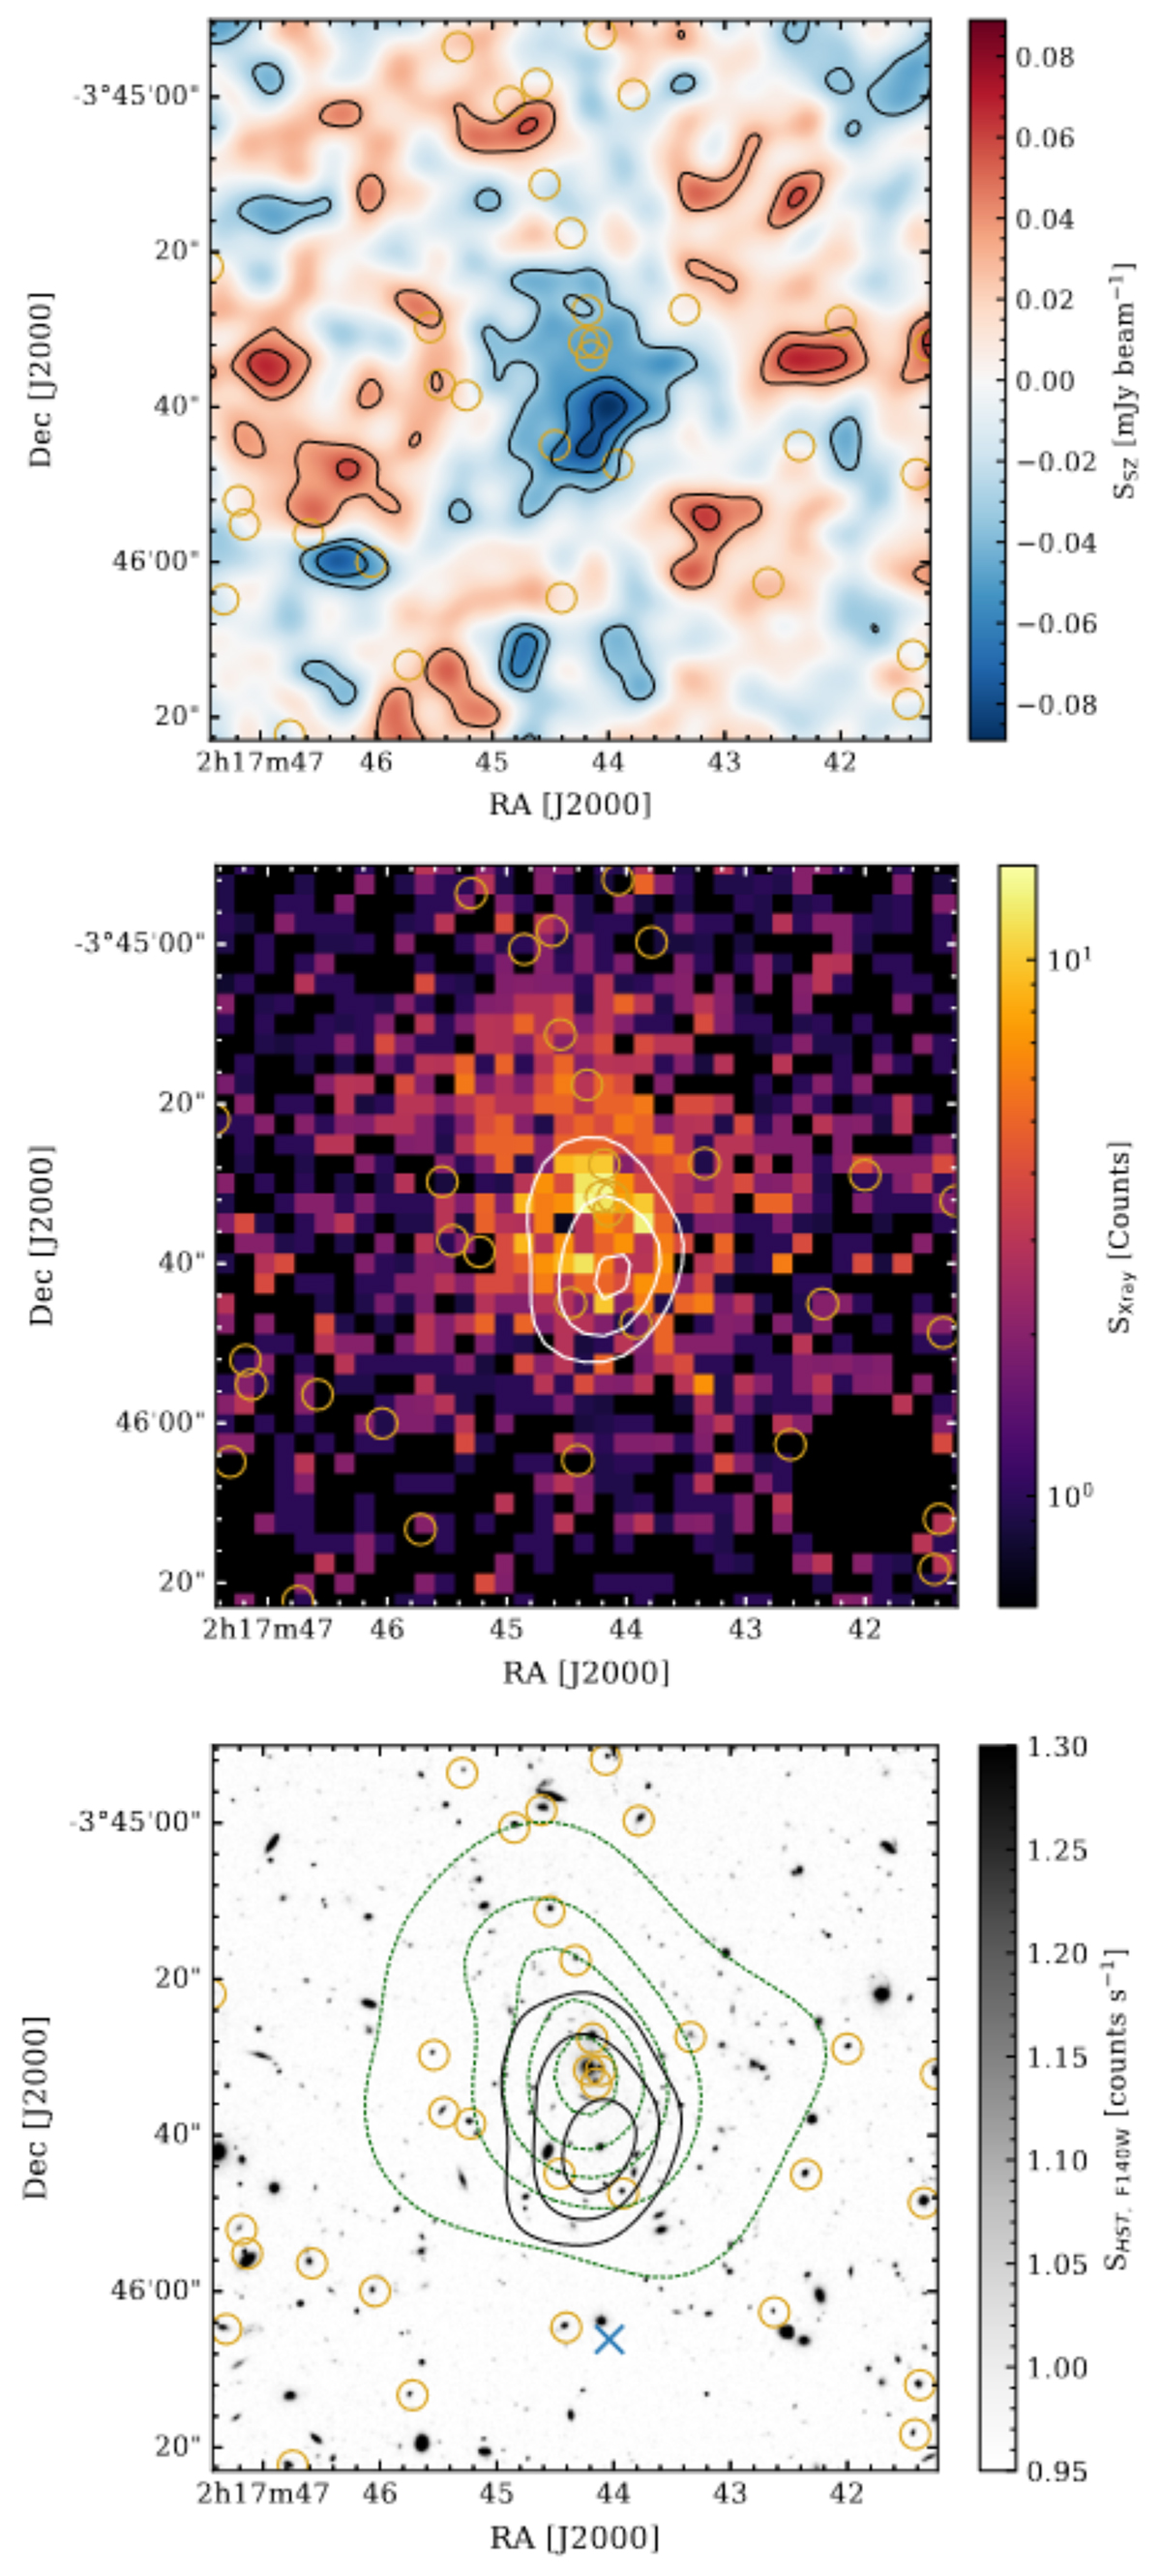
Download original image
Multiwavelegth view of XLSSC 122. Top: dirty map of the joint ALMA+ACA Band 3 observations overlaid with the distribution of member galaxies of the cluster shown as small gold circles, as in all other panels. The black contours are drawn at [−4.5, −3.5, −2.5, −1.5, 1.5, 2.5, 3.5]-σ. Middle: XMM-Newton image of Mantz et al. (2018) overlaid with the directly visible SZ decrement as seen by the ALMA+ACA imaging with a uv-taper of 10 kλ. Bottom: HST imaging from Willis et al. (2020) used to find the cluster members. Here, we overlay in black the directly visible SZ decrement as seen by the ALMA+ACA observations, and in dark green, we show the adaptively smoothed X-ray contours drawn at [2, 4, 6, 8, 10]-σ. We further highlight the SZ centroid derived from CARMA measurements (Mantz et al. 2018) with the blue cross. Overall, this figure indicates a coherence between the pressure and density distribution of the ICM seen by ALMA+ACA and X-ray measurements, and the cluster member distribution.
Current usage metrics show cumulative count of Article Views (full-text article views including HTML views, PDF and ePub downloads, according to the available data) and Abstracts Views on Vision4Press platform.
Data correspond to usage on the plateform after 2015. The current usage metrics is available 48-96 hours after online publication and is updated daily on week days.
Initial download of the metrics may take a while.