Open Access
Fig. 2.
Download original image
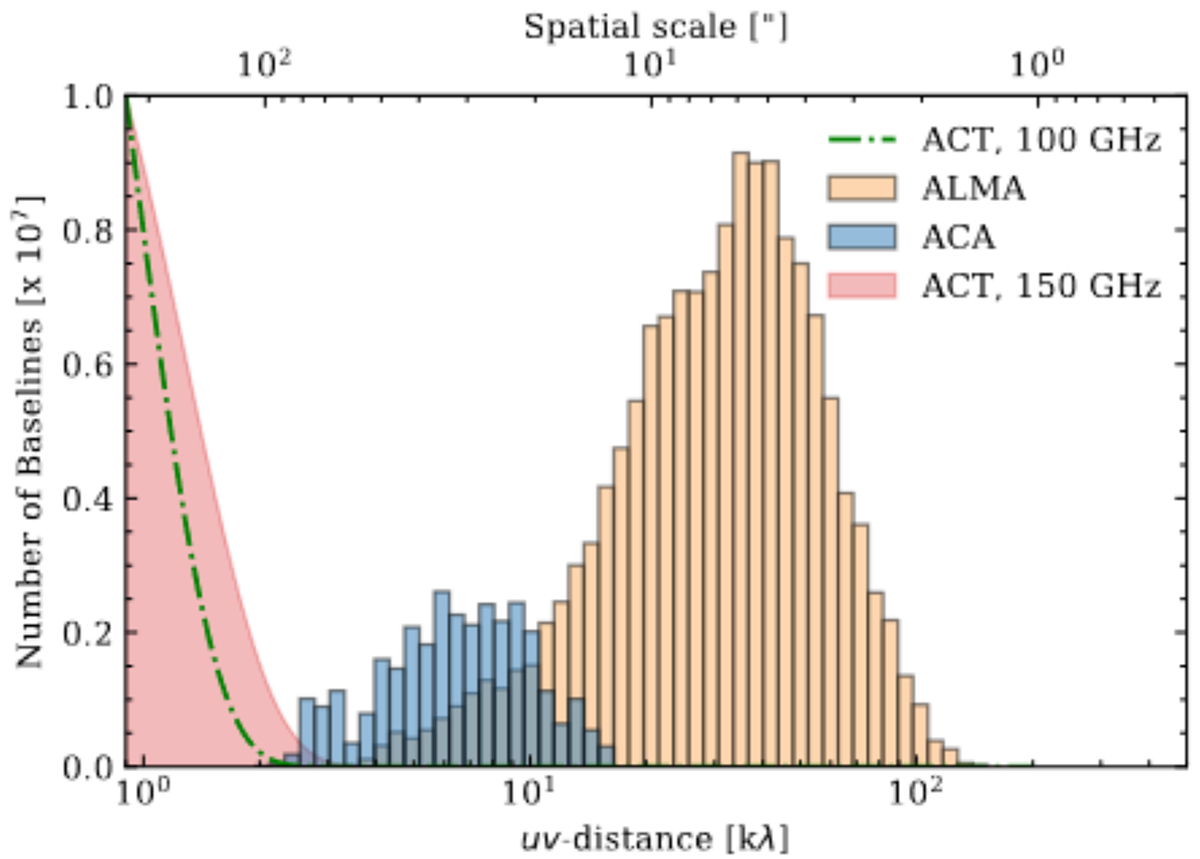
Distribution of the number of visibilities as a function of the uv-distance sampled with ALMA (yellow) and ACA (blue) Band-3 observations. In red, we overlay the ACT beam at 150 GHz (![]() ) and 100 GHz (
) and 100 GHz (![]() ) as a green dashed line. The y-axis is scaled using arbitrary values regarding the ACT beams.
) as a green dashed line. The y-axis is scaled using arbitrary values regarding the ACT beams.
Current usage metrics show cumulative count of Article Views (full-text article views including HTML views, PDF and ePub downloads, according to the available data) and Abstracts Views on Vision4Press platform.
Data correspond to usage on the plateform after 2015. The current usage metrics is available 48-96 hours after online publication and is updated daily on week days.
Initial download of the metrics may take a while.