Fig. 15.
Download original image
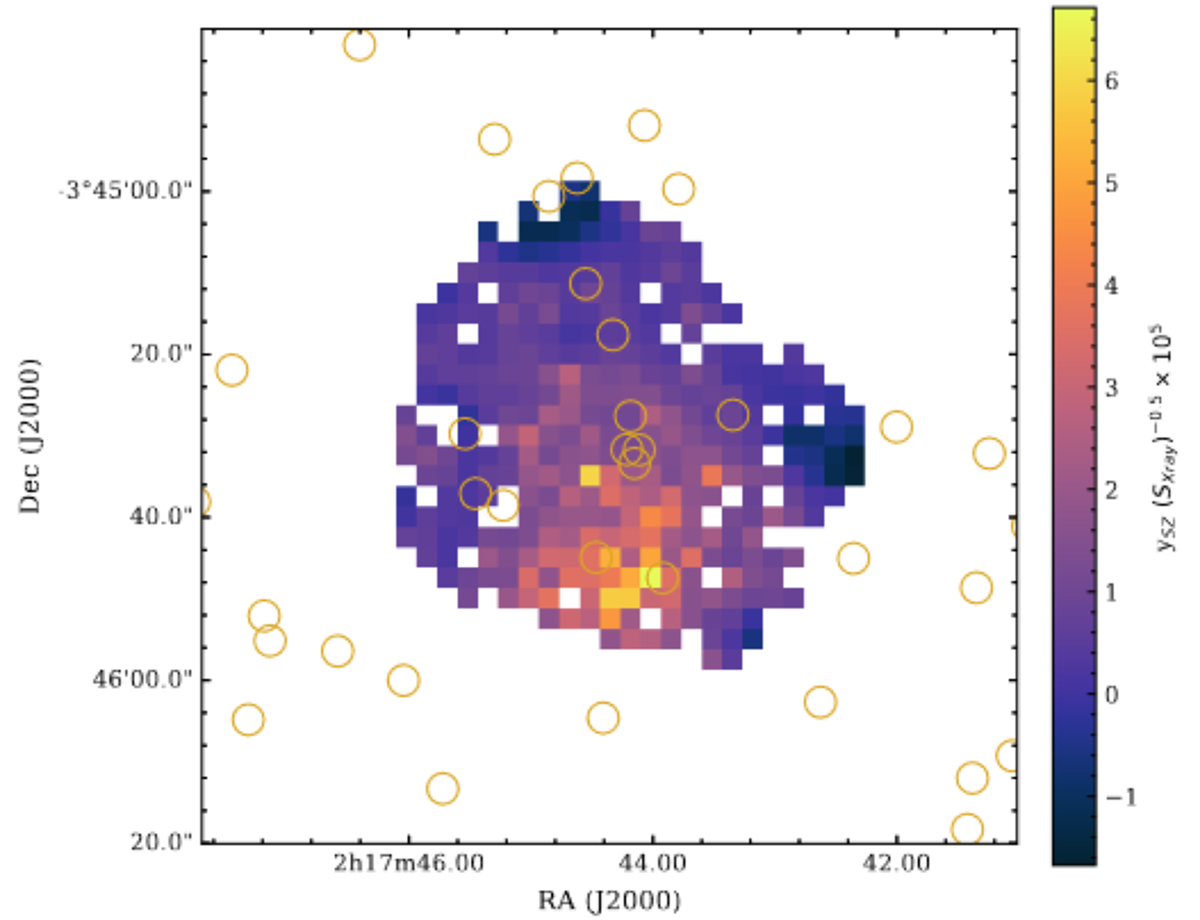
Pseudo-kBTe (![]() ) map of XLSSC 122. It takes the ratio of the cleaned SZ map (Fig. 11) and the X-ray surface brightness (2nd panel of Fig. 3) within the 2σ adaptively smoothed X-ray contours (also shown in Figs. 3 and 14). The units are linearly scaled to an arbitrary value to show the relative pseudo temperature change in the south of XLSSC 122.
) map of XLSSC 122. It takes the ratio of the cleaned SZ map (Fig. 11) and the X-ray surface brightness (2nd panel of Fig. 3) within the 2σ adaptively smoothed X-ray contours (also shown in Figs. 3 and 14). The units are linearly scaled to an arbitrary value to show the relative pseudo temperature change in the south of XLSSC 122.
Current usage metrics show cumulative count of Article Views (full-text article views including HTML views, PDF and ePub downloads, according to the available data) and Abstracts Views on Vision4Press platform.
Data correspond to usage on the plateform after 2015. The current usage metrics is available 48-96 hours after online publication and is updated daily on week days.
Initial download of the metrics may take a while.