Fig. 13.
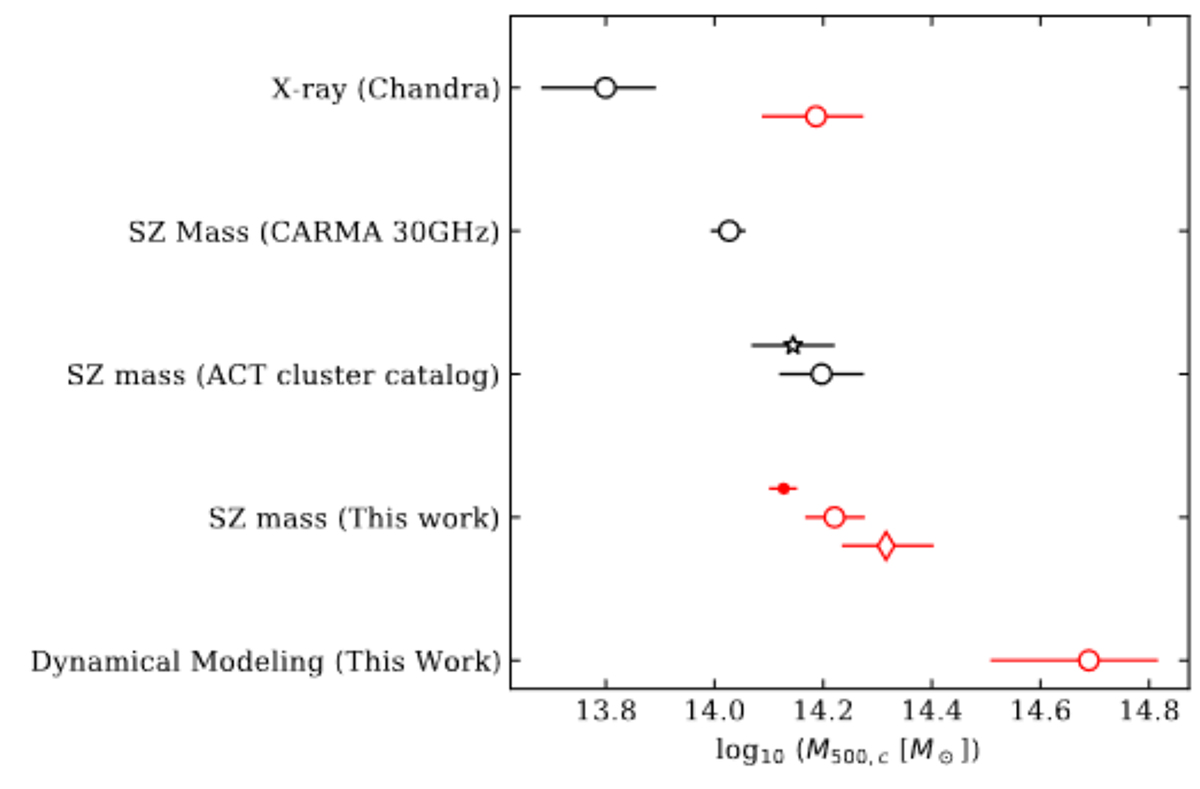
Download original image
Overview of halo masses (M500, c) of XLSSC 122. In red, we show the halo masses derived in this work. Regarding SZ measurements, the red open circle corresponds to the likelihood-weighted average of all masses derived from the empirical formalism (Table 2, lower table). The dot represents the mass estimates from the spherically symmetric model and the diamond that of elliptical ones. For the halo masses reported in the ACT cluster catalog, the star shows the calibrated mass estimate, and the circle the SZ mass obtained by matched filtering the frequency maps. The reported errors correspond to the 16th − 84th quantiles. This figure shows the discrepancies between the derived M500, c indicating that with forming clusters, one cannot reliably use one tracer or constant gas fraction to estimate the true halo mass.
Current usage metrics show cumulative count of Article Views (full-text article views including HTML views, PDF and ePub downloads, according to the available data) and Abstracts Views on Vision4Press platform.
Data correspond to usage on the plateform after 2015. The current usage metrics is available 48-96 hours after online publication and is updated daily on week days.
Initial download of the metrics may take a while.