Fig. 11.
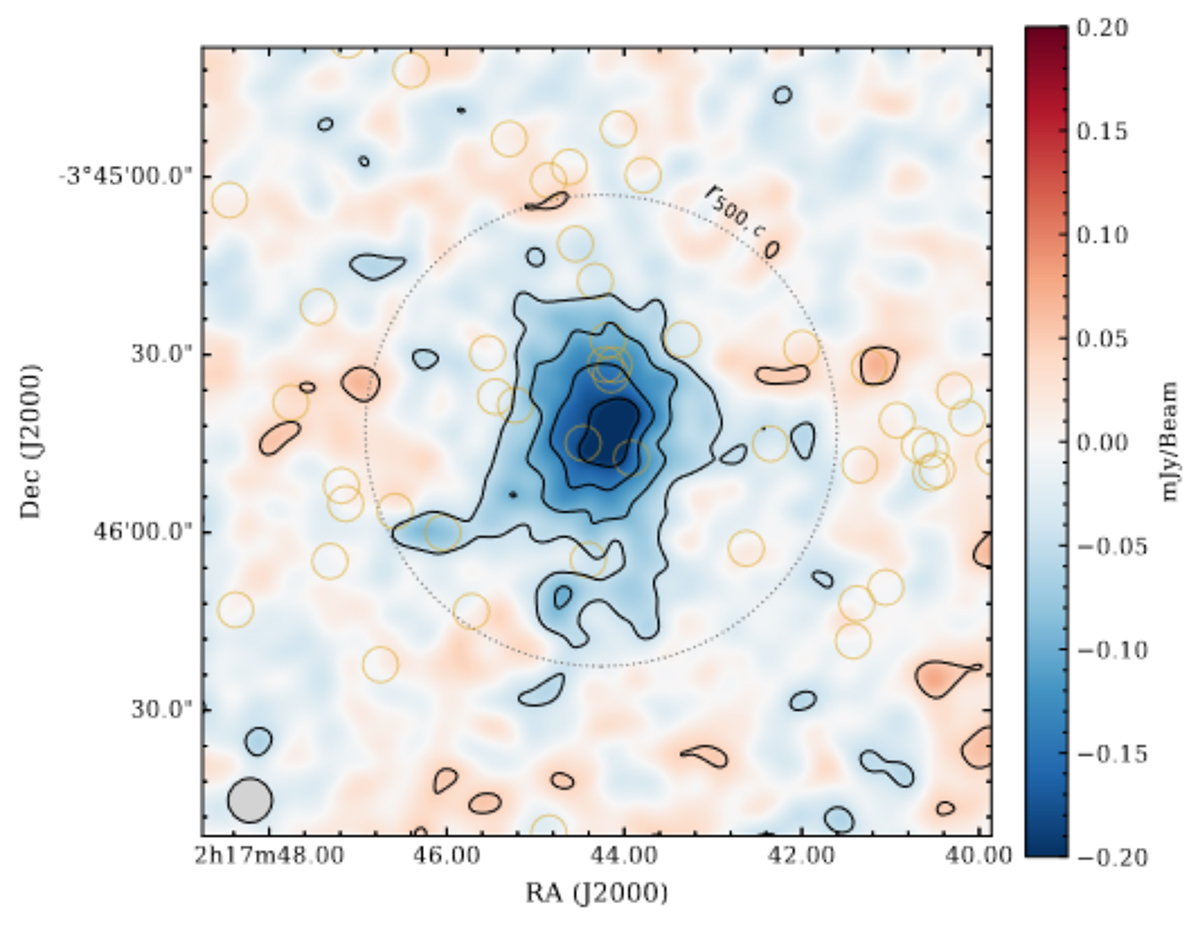
Download original image
“Cleaned” ACA+ALMA image of XLSSC 122. Here we combined the likelihood-weighted reconstructed model of a single elliptical gNFW profile (see row five of Table 1), smoothed with the synthesized beam, together with the imaged residuals, computed in the uv-plane. Hence, we corrected for the dirty beam patterns visible in Figure 5. Contours are drawn from [−10, −8, −6, −4, −2, 2, 4]-σ estimated on the residual map shown in Figure 5. We overlay the location of the cluster members and indicate r500,c centered on the peak of the SZ flux. We observe asymmetric features in the south, potentially indicating a morphological disturbance to the cluster.
Current usage metrics show cumulative count of Article Views (full-text article views including HTML views, PDF and ePub downloads, according to the available data) and Abstracts Views on Vision4Press platform.
Data correspond to usage on the plateform after 2015. The current usage metrics is available 48-96 hours after online publication and is updated daily on week days.
Initial download of the metrics may take a while.