Fig. 1.
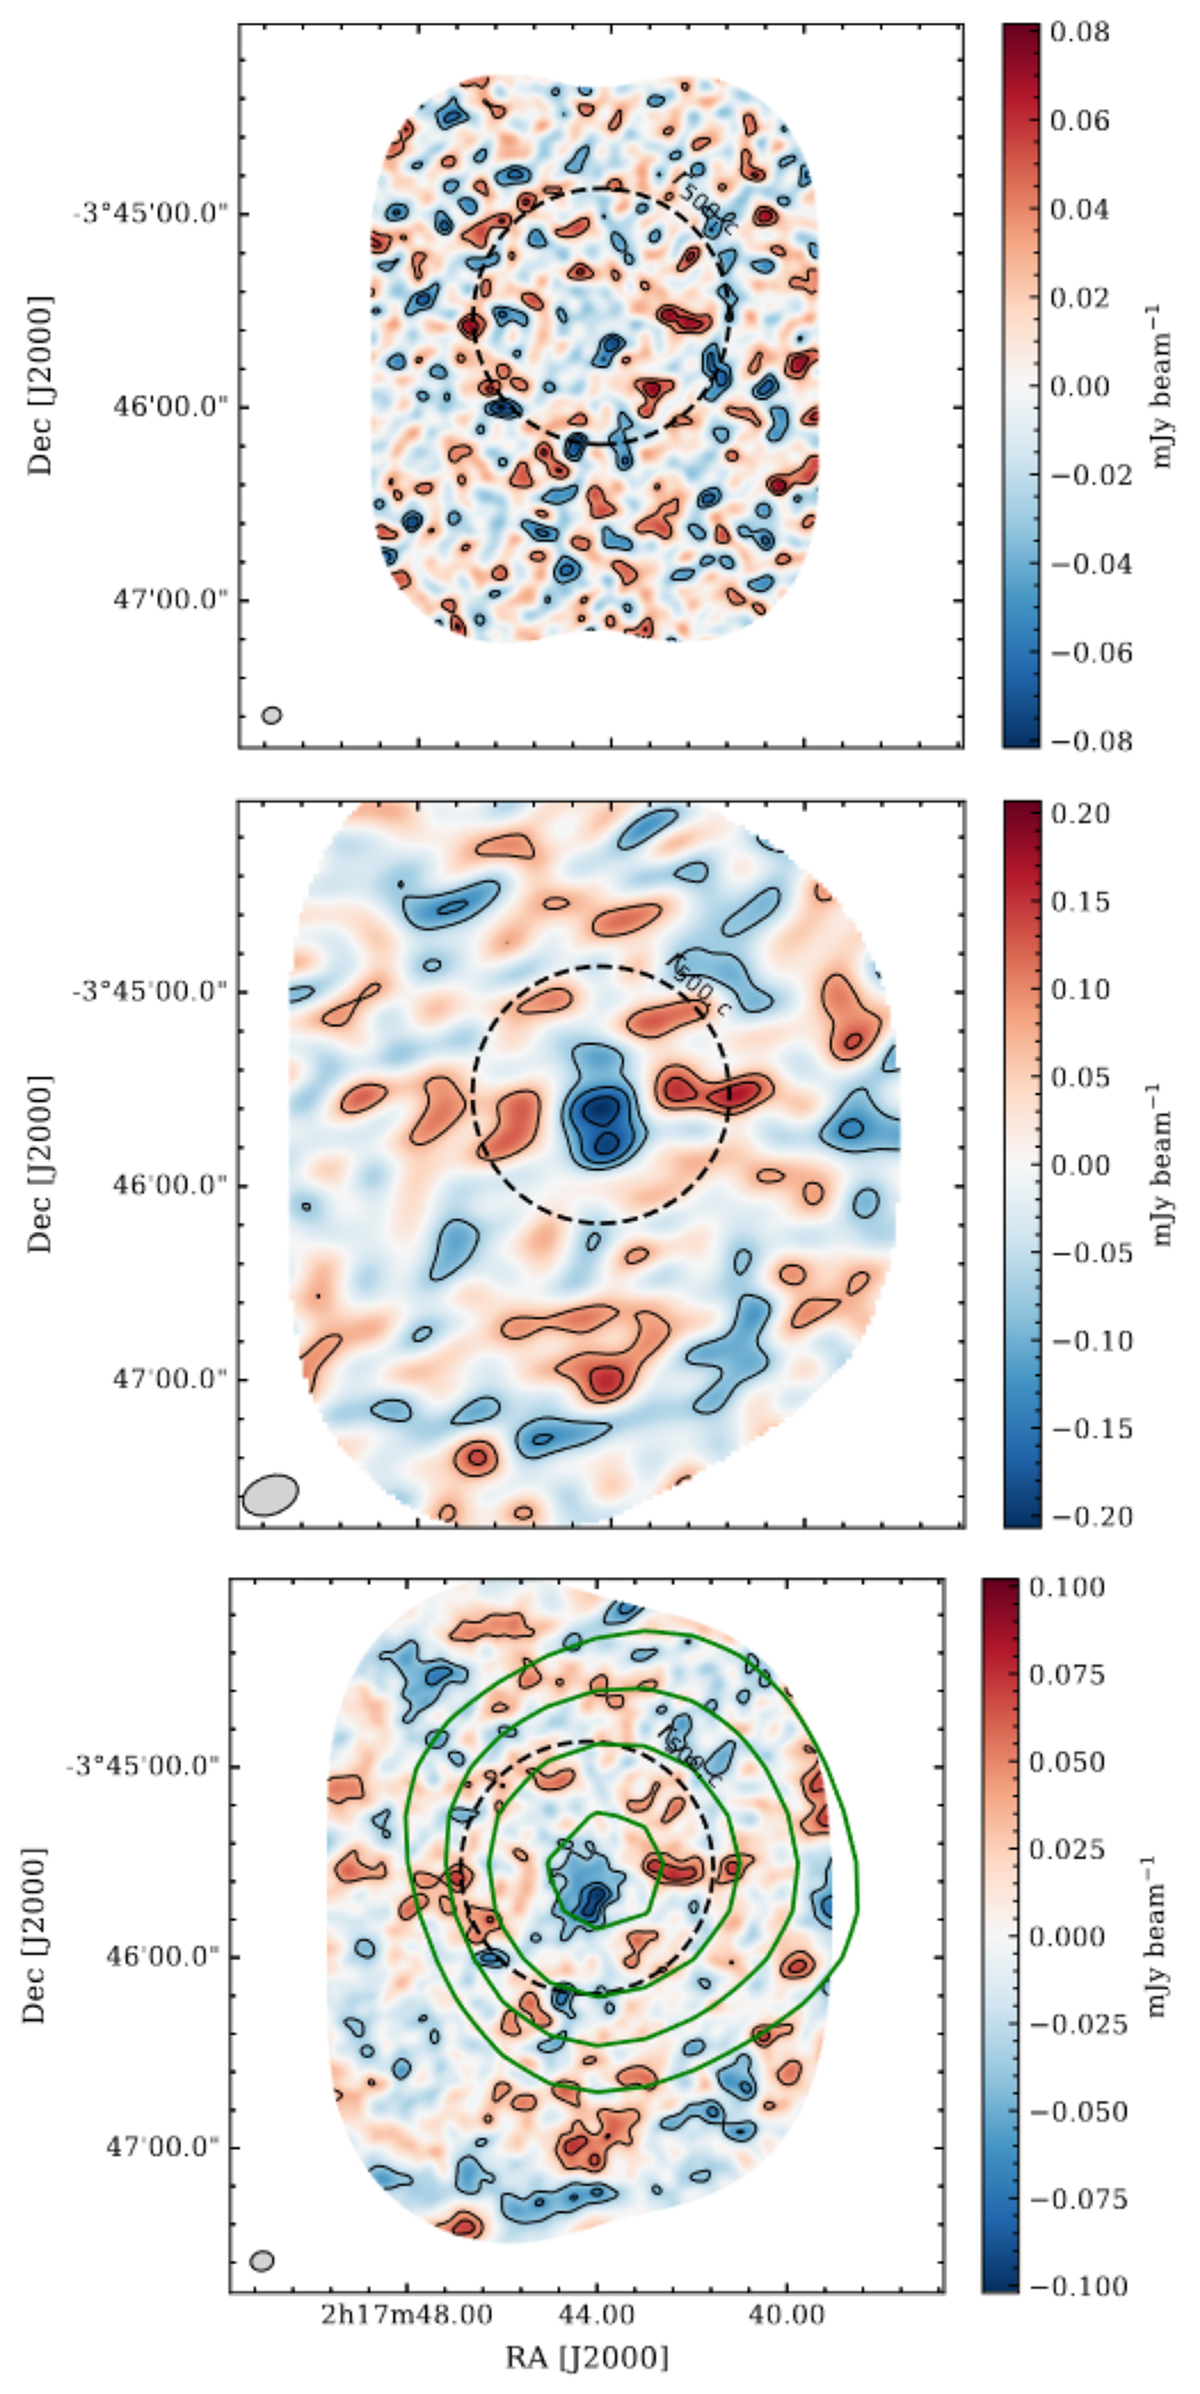
Download original image
ALMA observations of XLSSC 122. From top to bottom, we show the raw (dirty) continuum images of the 12 m-array mosaic, ACA mosaic, and the jointly imaged Band 3 observations. The latter image (bottom panel) is tapered with a uv-taper of 20 kλ. Black contours in each panel are drawn at [−4.5, −3.5, −2.5, −1.5, 1.5, 2.5, 3.5]-σ except for the top panel, which excluded the ±1.5σ contours. We find a central noise RMS of σ = 0.051, 0.014, 0.022 mJy beam−1, respectively. The dashed circles in all panels indicate r500, c centered on the BCG. The green contours in the bottom panel indicate the ACT-y map contours and are drawn at [2.5, 3.5, 4.5, 5.5] times the local noise level. The beams of the ACA, ALMA, and jointly imaged ACA+ALMA observations are indicated in the lower-left corner of each panel. We clearly see that the ACT and ALMA+ACA observations align spatially.
Current usage metrics show cumulative count of Article Views (full-text article views including HTML views, PDF and ePub downloads, according to the available data) and Abstracts Views on Vision4Press platform.
Data correspond to usage on the plateform after 2015. The current usage metrics is available 48-96 hours after online publication and is updated daily on week days.
Initial download of the metrics may take a while.