Fig. 3
Download original image
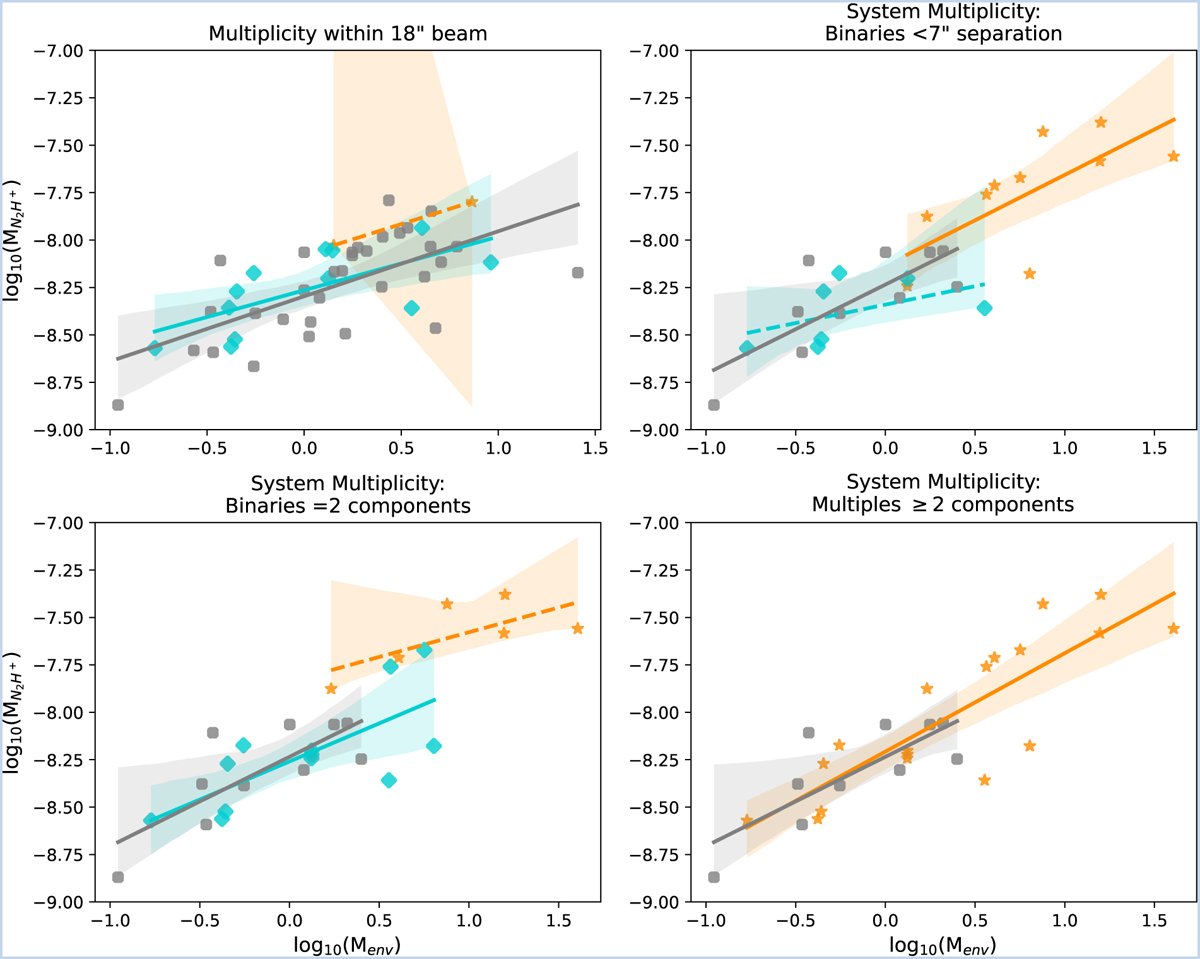
Relations of the N2H+ gas mass, Mgas(N2H+), and envelope dust mass, Mmenv, for the sample. The orange stars show multiple systems, the cyan diamonds show binary systems, and the gray circles show single protostellar systems. Each panel represents one of four ways of grouping the sample and their corresponding correlations. The lines and shaded areas show the linear regression for the data with the corresponding color. The solid lines indicate statistically significant correlations (Pearson r and Spearman ρ p-values <0.05), and the dashed lines show subsamples with p-values >0.05; see Sect. 5.5 for a discussion of the figure).
Current usage metrics show cumulative count of Article Views (full-text article views including HTML views, PDF and ePub downloads, according to the available data) and Abstracts Views on Vision4Press platform.
Data correspond to usage on the plateform after 2015. The current usage metrics is available 48-96 hours after online publication and is updated daily on week days.
Initial download of the metrics may take a while.