Fig. 2

Download original image
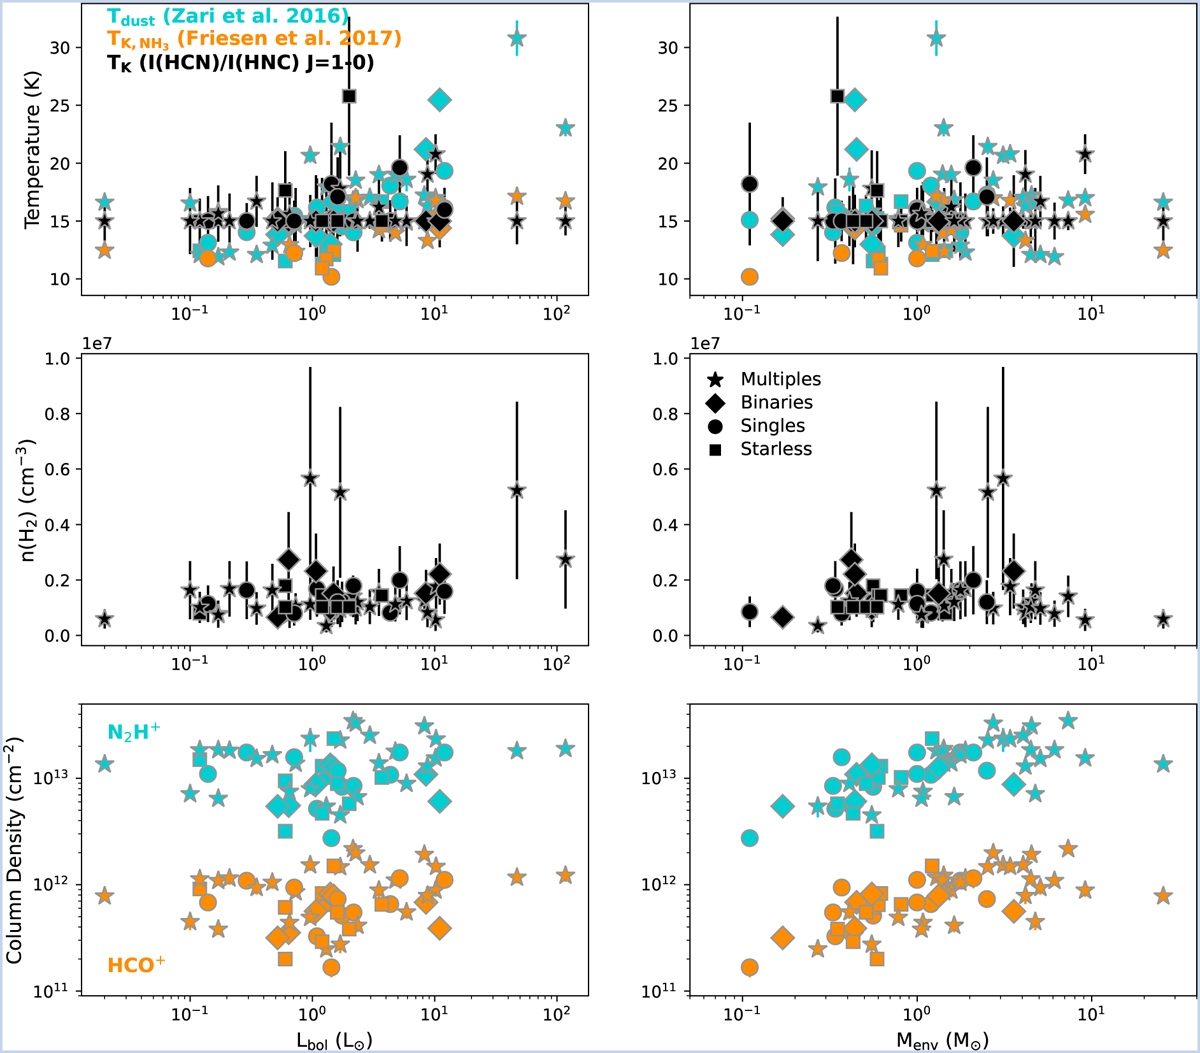
Gas and dust temperature (first row), derived H2 volumetric density from the HNC J=4–3/J=1–0 ratio (second row), and derived N2H+ J=1–0 and HCO+ J=1–0 column density (third row) vs. source bolometric luminosity Lbol (left column) and envelope mass Menv (right column). In the bottom row, the error bars are about the size of the plotted points. The starless cores (squares) HH211, and L1445 IRS2 adopt the average H2 volume density for their respective region (see Table A.5).
Current usage metrics show cumulative count of Article Views (full-text article views including HTML views, PDF and ePub downloads, according to the available data) and Abstracts Views on Vision4Press platform.
Data correspond to usage on the plateform after 2015. The current usage metrics is available 48-96 hours after online publication and is updated daily on week days.
Initial download of the metrics may take a while.


