Fig. 1
Download original image
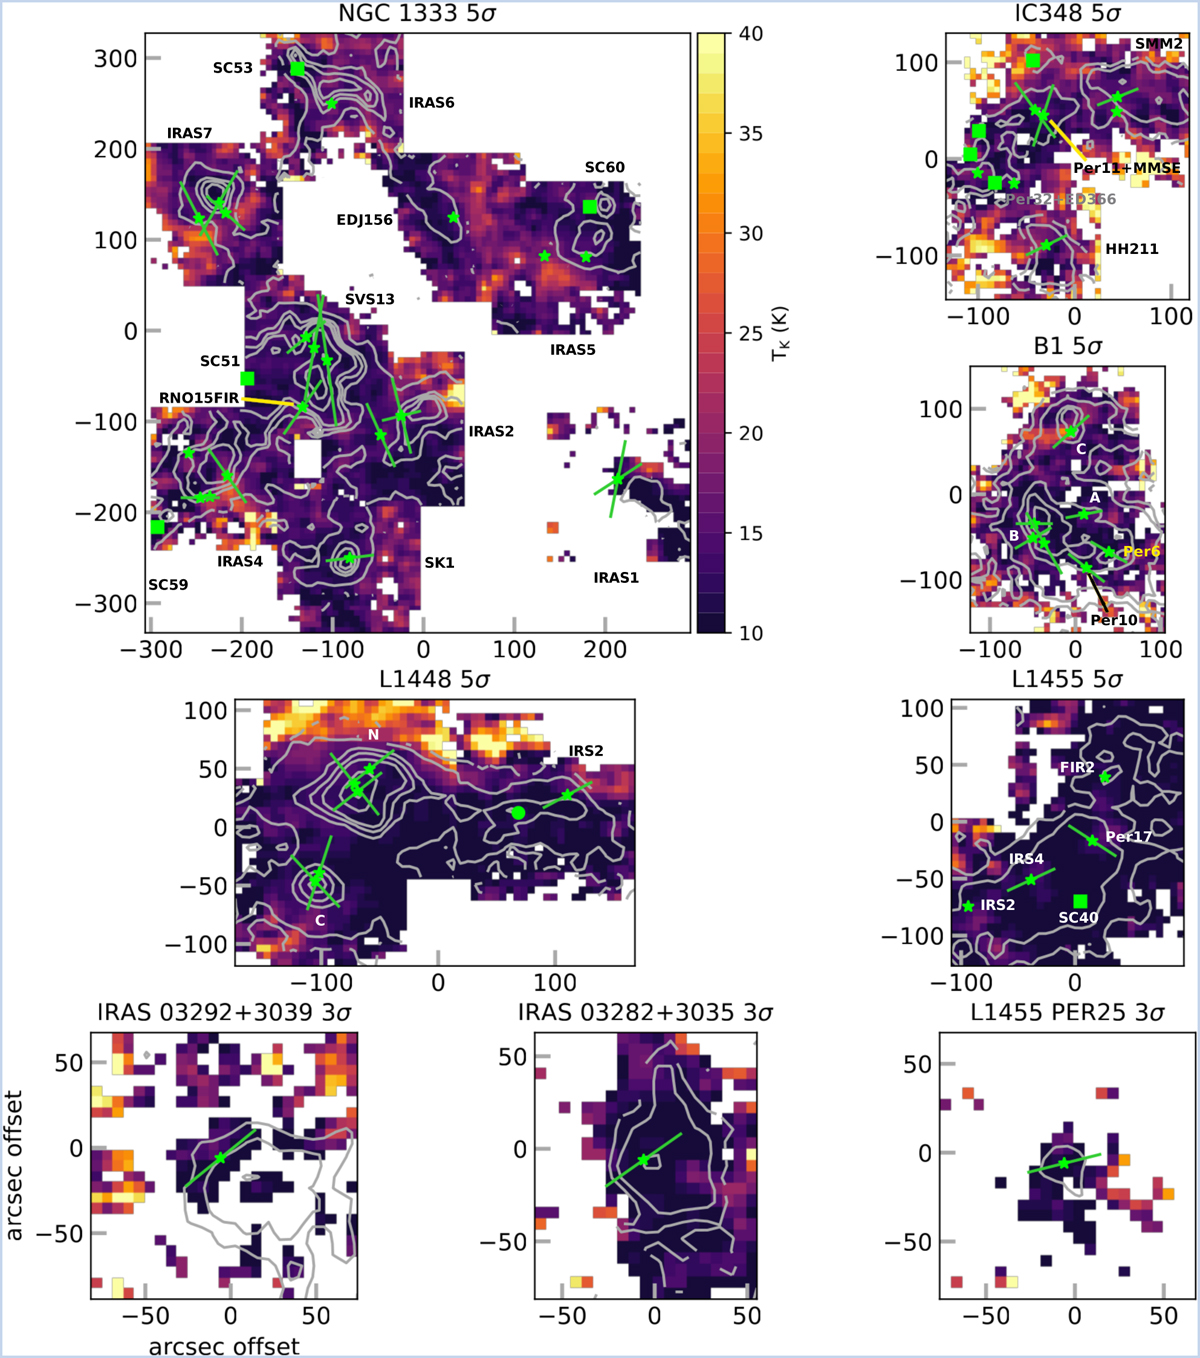
Kinetic gas temperature map derived from the I(HCN)/I(HNC) J=1–0 ratio (the color scale is the same as Fig. B.7) overlaid with the integrated intensity map of diazenylium N2H+ J=1–0 (gray contours in steps of 3, 5, 10, 15, 20, 25, and 30 K km s−1; see also Fig. B.4) for each observed region. All maps are shown with the same color-scale range for comparison. The σ value above each panel indicates the cutoff value for both maps. Stars mark the positions of protostellar sources, and squares mark the locations of starless cores. The filled circle marks the position of L1448 IRS2E, whose nature is debated. Straight lines indicate the outflow directions for the protostellar systems included in the MASSES survey (Stephens et al. 2017).
Current usage metrics show cumulative count of Article Views (full-text article views including HTML views, PDF and ePub downloads, according to the available data) and Abstracts Views on Vision4Press platform.
Data correspond to usage on the plateform after 2015. The current usage metrics is available 48-96 hours after online publication and is updated daily on week days.
Initial download of the metrics may take a while.