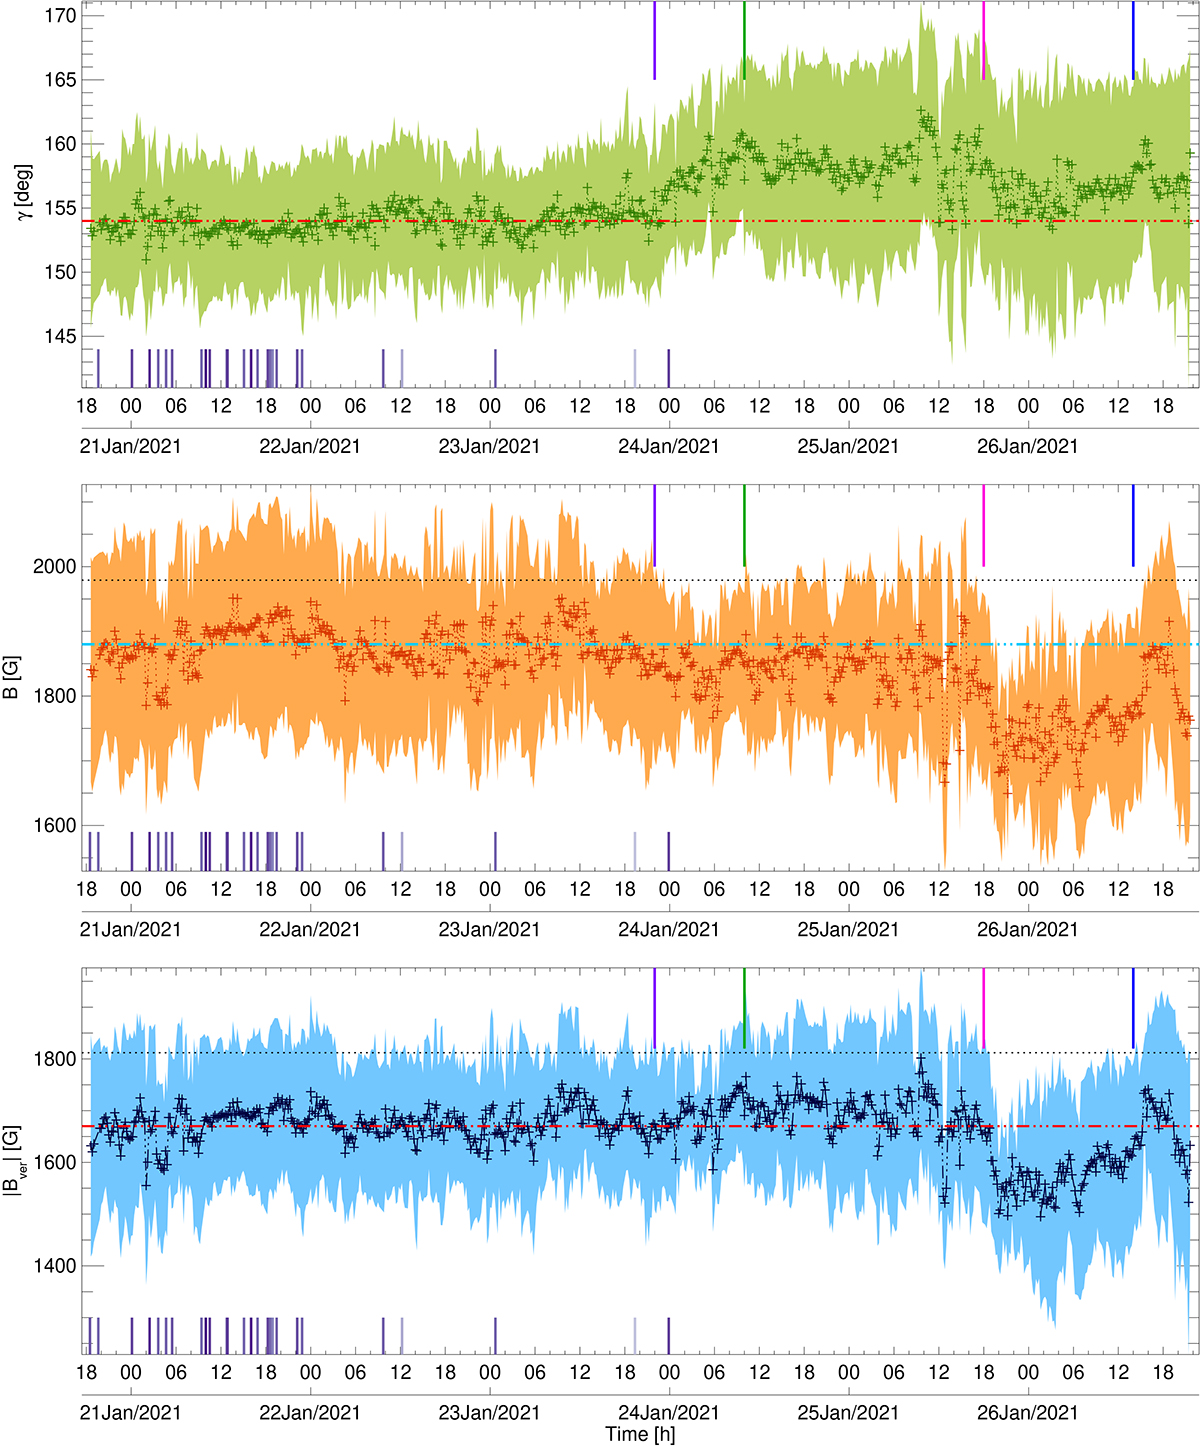
Fig. 6.
Download original image
Temporal evolution of the magnetic properties: γ (in green, top), B (in orange, middle), and Bver (in blue, bottom) averaged along the UP boundary in HMIdcon maps. The filled areas stand for the standard deviation of the averaged properties. The dotted horizontal lines (1821 G and 1979 G) mark the maximum B and Bver found in an evolving pore in HMIdcon maps in García-Rivas et al. (2021), but retrieved from the Ic, dcon = 0.50 IQS contour instead of the Ic, dcon = 0.55 IQS reported in the study. The dash-dotted horizontal lines (154°, 1880 G, 1670 G) mark the average γ, B and Bver during the slow decay as a reference. The upper vertical lines indicate the times of specific evolutionary stages: The beginning of the fast decay (purple), the end of the fast decay (green), the accumulation of new flux (pink), and the decrease in the spot area (blue). The bottom vertical lines indicate the flaring times of AR 12798. The colour relates to the GOES flare class, from lighter purple (weakest: A5.6) to darker purple (strongest: B5.4).
Current usage metrics show cumulative count of Article Views (full-text article views including HTML views, PDF and ePub downloads, according to the available data) and Abstracts Views on Vision4Press platform.
Data correspond to usage on the plateform after 2015. The current usage metrics is available 48-96 hours after online publication and is updated daily on week days.
Initial download of the metrics may take a while.