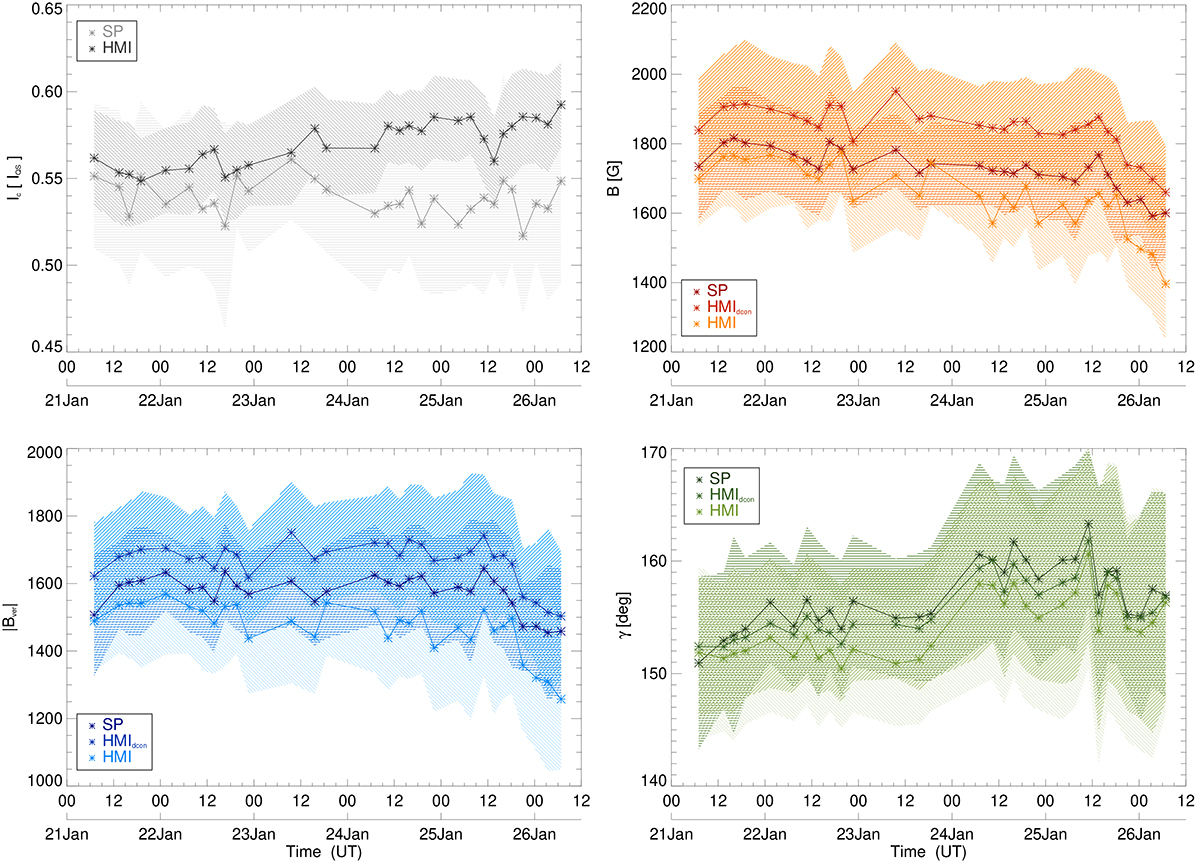
Fig. 5.
Download original image
Temporal evolution of the properties averaged along the HMIdcon threshold Ic = 0.50 IQS in the SP, HMI, and HMIdcon maps. The striped areas illustrate the standard deviation of the averaged properties (β = 0°: SP, β = 45°: HMIdcon, and β = 135°: HMI). Top left: Continuum intensity (Iqs). Top right: Total magnetic field strength (B). Bottom left: Vertical magnetic field (Bver). Bottom right: LRF inclination (γ).
Current usage metrics show cumulative count of Article Views (full-text article views including HTML views, PDF and ePub downloads, according to the available data) and Abstracts Views on Vision4Press platform.
Data correspond to usage on the plateform after 2015. The current usage metrics is available 48-96 hours after online publication and is updated daily on week days.
Initial download of the metrics may take a while.