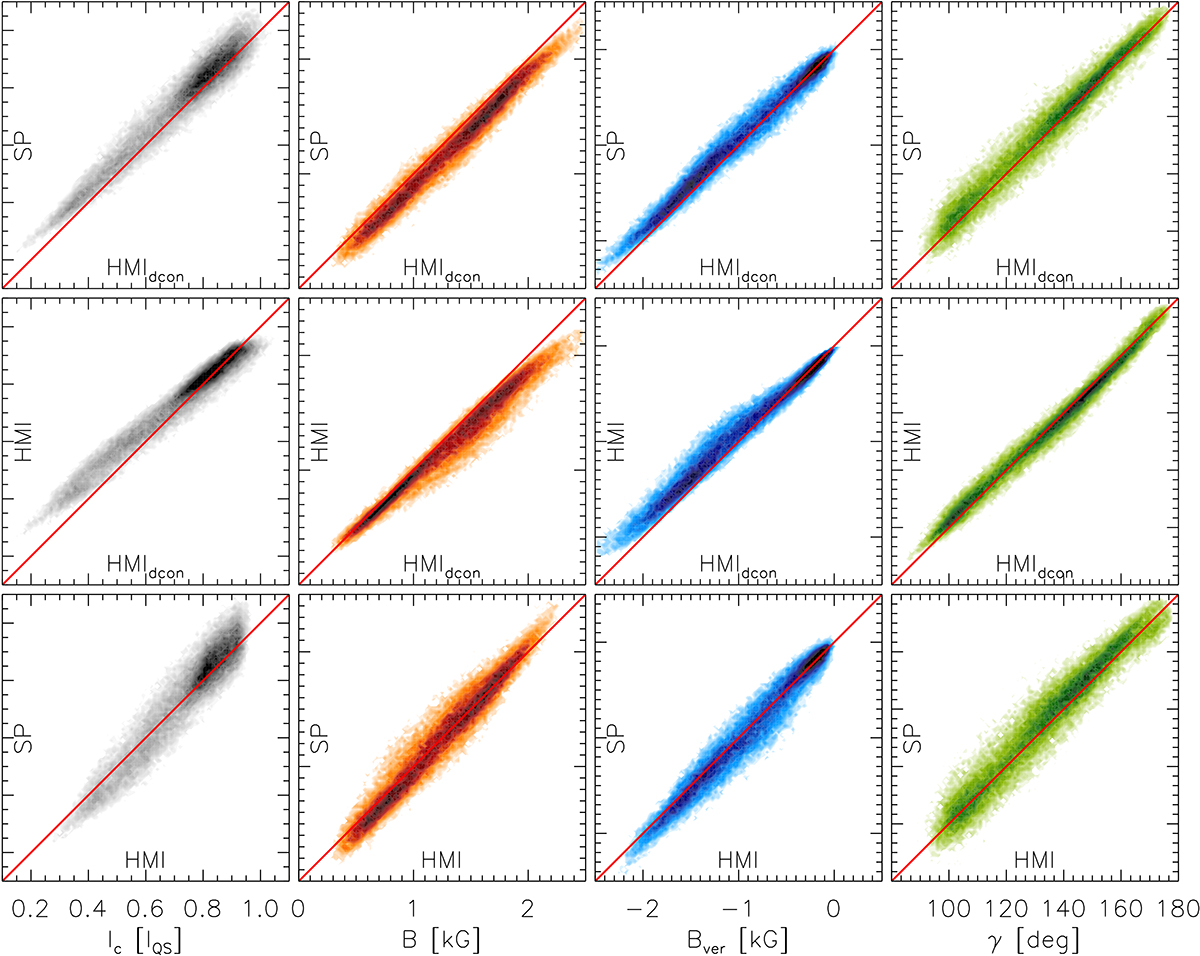
Fig. 3.
Download original image
Density functions comparing the continuum intensity (Ic, grey), total magnetic field (B, orange), vertical magnetic field (Bver, blue), and magnetic field inclination (γ, green) between the SP, HMI, and HMIdcon datasets. Top row: SP vs. HMIdcon. Middle row: HMI vs. HMIdcon. Bottom row: SP vs. HMI. The red line marks the one-to-one correspondence. The spans of the y-axes are identical to those of the x-axes.
Current usage metrics show cumulative count of Article Views (full-text article views including HTML views, PDF and ePub downloads, according to the available data) and Abstracts Views on Vision4Press platform.
Data correspond to usage on the plateform after 2015. The current usage metrics is available 48-96 hours after online publication and is updated daily on week days.
Initial download of the metrics may take a while.