Open Access
Fig. 2.
Download original image
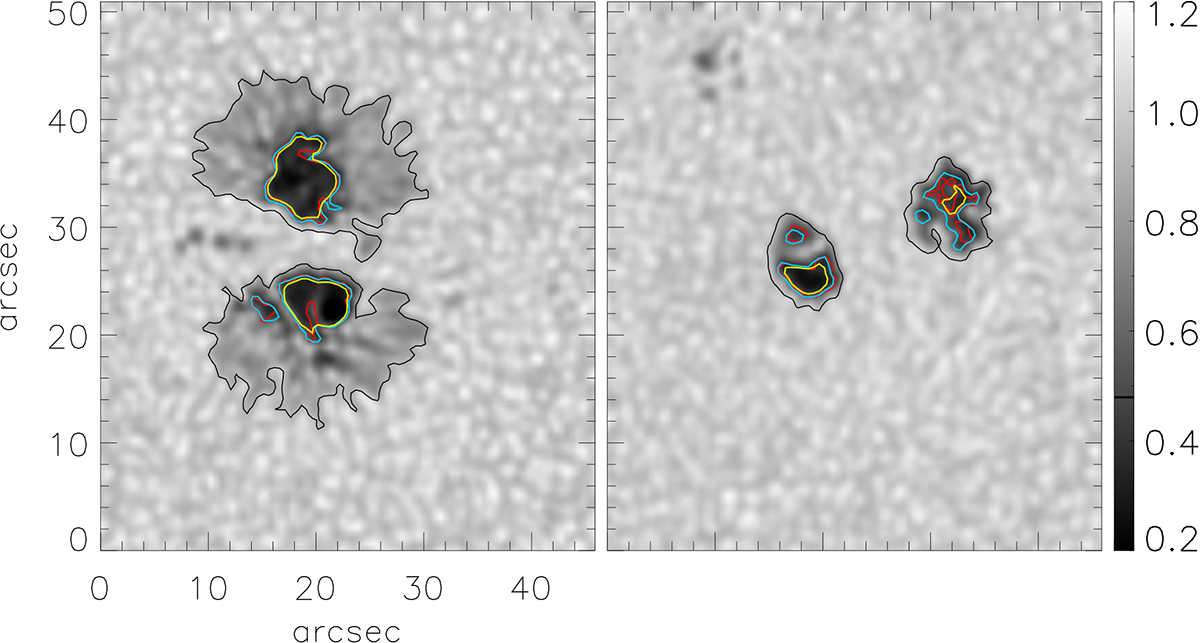
Examples of continuum intensity HMIdcon maps. The black lines outline the Ic = 0.90 IQS threshold. The colour lines mark the Ic = 0.50 IQS location in the SP (red), HMI (yellow) and HMIdcon (blue) co-temporal maps. Left: Sunspot stage on 22 January at 10:48 UT. Right: Naked-spots stage on 26 January at 06:48 UT.
Current usage metrics show cumulative count of Article Views (full-text article views including HTML views, PDF and ePub downloads, according to the available data) and Abstracts Views on Vision4Press platform.
Data correspond to usage on the plateform after 2015. The current usage metrics is available 48-96 hours after online publication and is updated daily on week days.
Initial download of the metrics may take a while.