Fig. 6.
Download original image
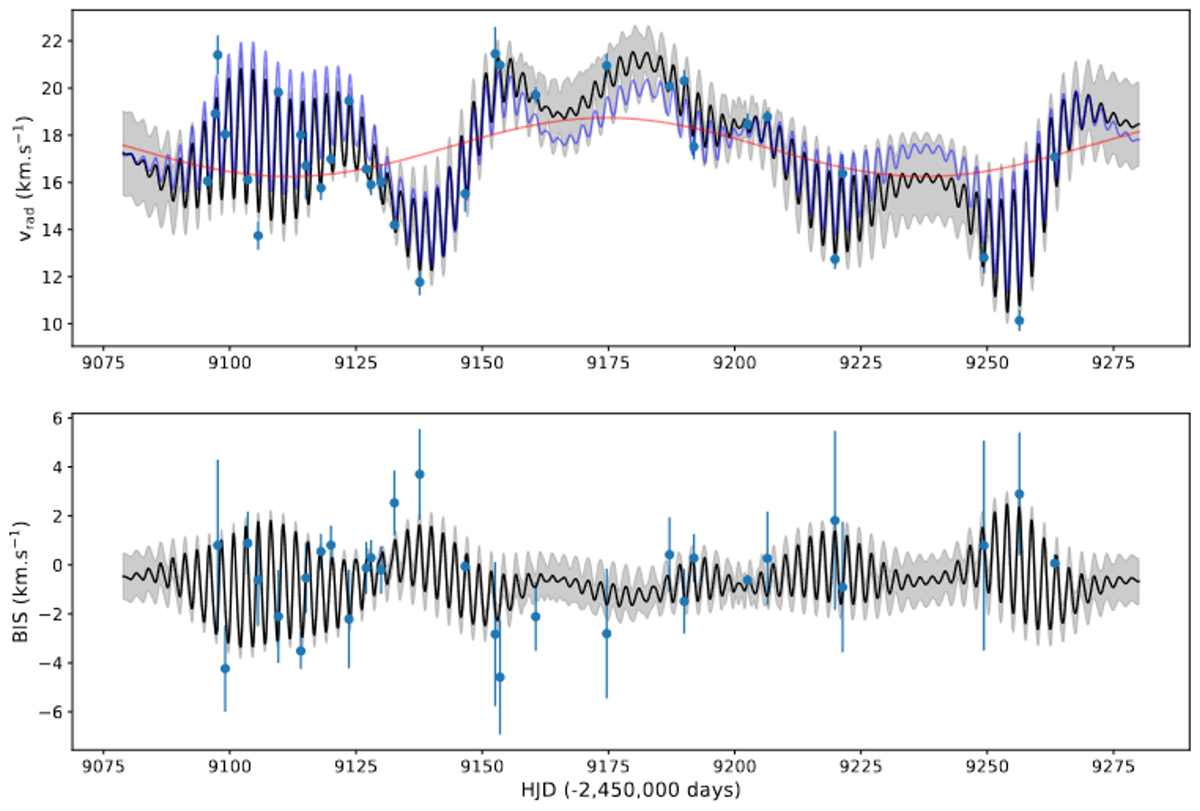
Fit of the RV (top) and BIS (bottom) curves with pyaneti. The blue points are the measurements with their uncertainties. On the top panel the black curve is the GP fit of the stellar activity (purple) plus the Keplerian modulation by the companion (red). The grey-shaded area is the 1σ uncertainty of the fit. On the bottom panel the black curve is showing the GP fit of the stellar activity only with its 1σ uncertainty in grey.
Current usage metrics show cumulative count of Article Views (full-text article views including HTML views, PDF and ePub downloads, according to the available data) and Abstracts Views on Vision4Press platform.
Data correspond to usage on the plateform after 2015. The current usage metrics is available 48-96 hours after online publication and is updated daily on week days.
Initial download of the metrics may take a while.