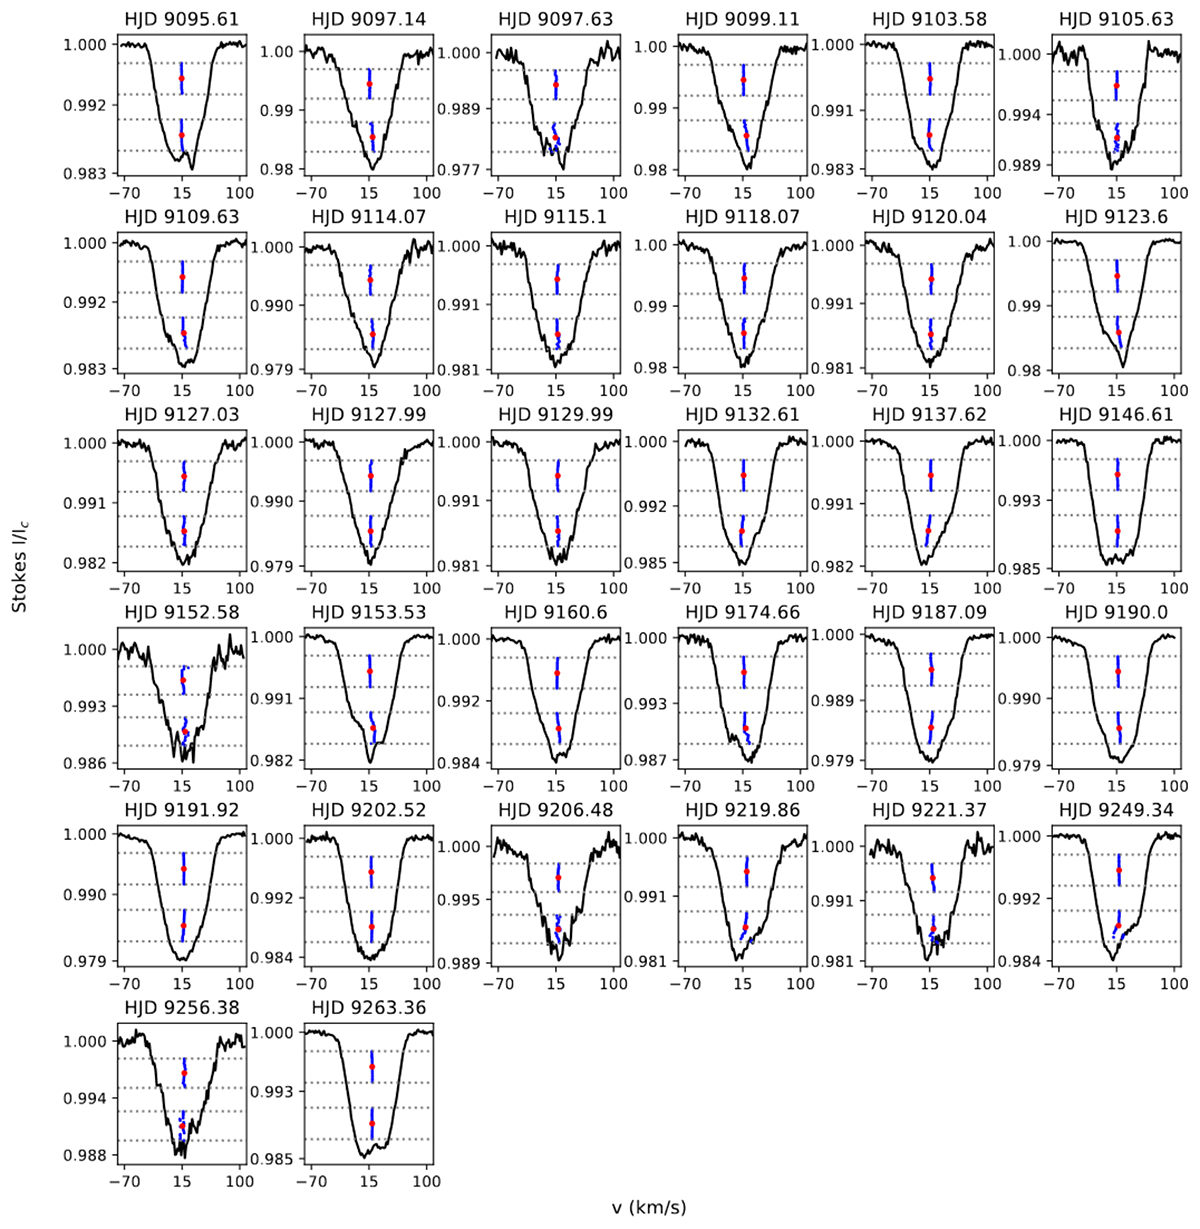
Fig. 2.
Download original image
Measurement of the BIS of the Stokes I profiles. The HJD is indicated at the top of each plot. The black lines are the Stokes I profiles and the grey dotted line delimits the top and bottom regions selected for the BIS computation. The blue points are the bisector in these regions and the red dots are the mean bisector of each region used to compute the BIS.
Current usage metrics show cumulative count of Article Views (full-text article views including HTML views, PDF and ePub downloads, according to the available data) and Abstracts Views on Vision4Press platform.
Data correspond to usage on the plateform after 2015. The current usage metrics is available 48-96 hours after online publication and is updated daily on week days.
Initial download of the metrics may take a while.