Fig. 1.
Download original image
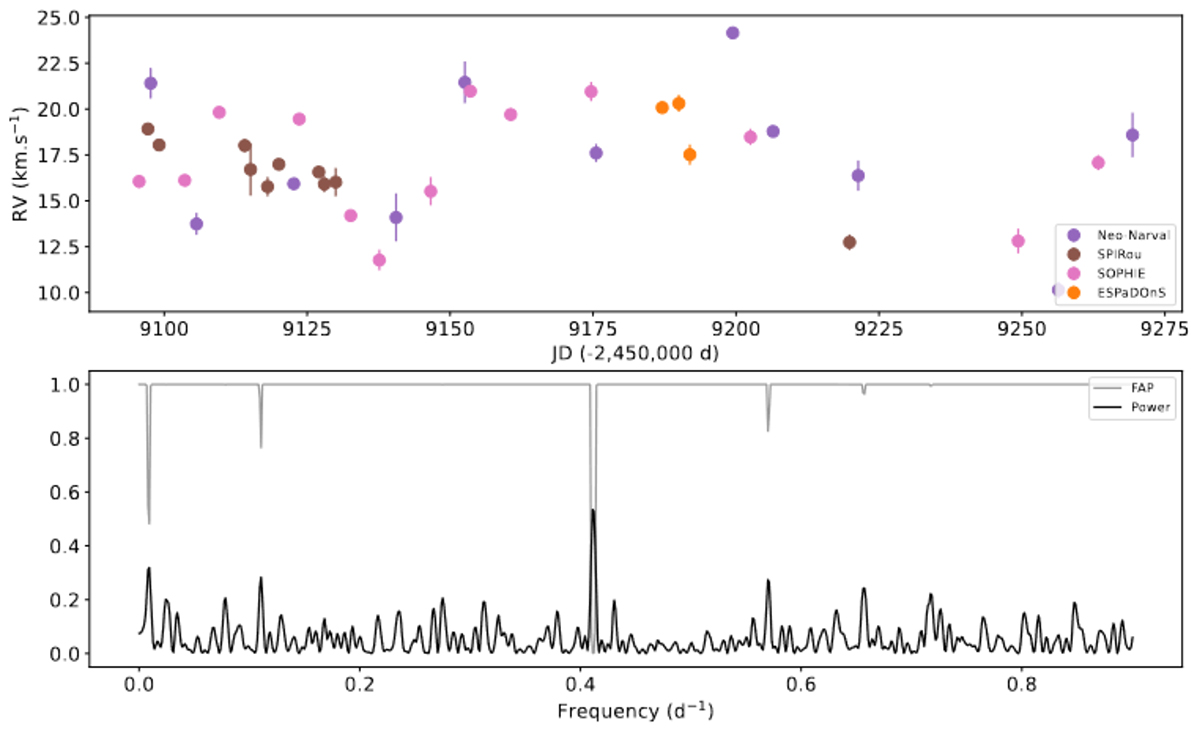
Radial velocity curve (top) and corresponding Lomb-Scargle periodogram analysis (bottom) of HQ Tau over the 20B semester. The colors of the radial velocity curve correpond to the different instruments used: NeoNarval at TBL (purple), SOPHIE at OHP (pink), ESPaDOnS (orange), and SPIRou (brown) at CFHT. On the bottom panel the Lomb-Scargle periodogram is shown in black and the FAP in grey.
Current usage metrics show cumulative count of Article Views (full-text article views including HTML views, PDF and ePub downloads, according to the available data) and Abstracts Views on Vision4Press platform.
Data correspond to usage on the plateform after 2015. The current usage metrics is available 48-96 hours after online publication and is updated daily on week days.
Initial download of the metrics may take a while.