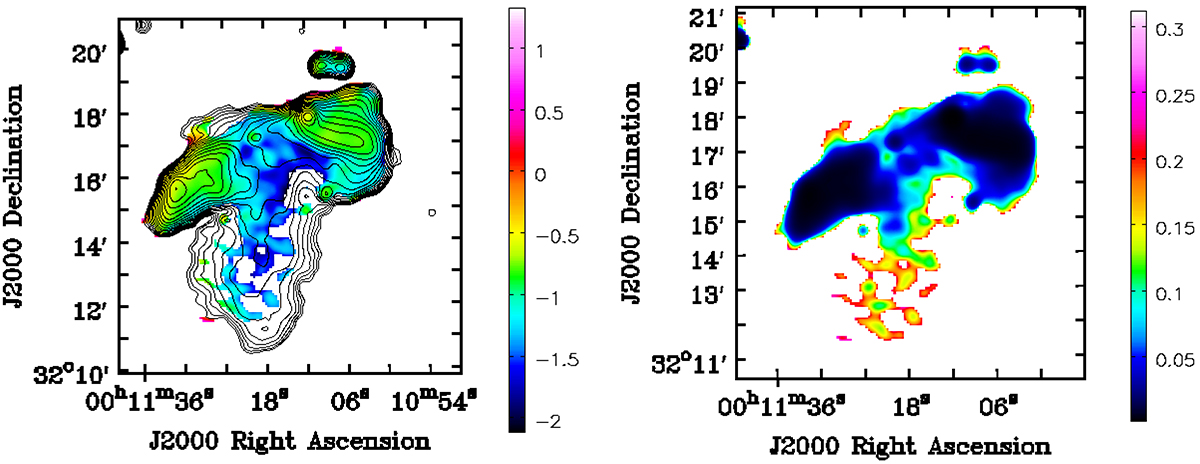
Fig. 8.
Download original image
Spectral index map of J0011+3217 between 144 MHz and 607 MHz of the peculiar radio galaxy J0011+3217. Left: A LoTSS DR2 image at 144 MHz (with 20″ × 20″ resolution) is overlaid in contours (levels: 0.23, 0.45, 0.75, 1.17, 1.75, 2.57, 3.72, 5.33, 7.58, 10.7, 15.1, 21.3, 30.0, 42.1, and 59.0 mJy beam−1) with the spectral index map of J0011+3217. Right: Spectral index error map of J0011+3217 between 144 MHz and 607 MHz.
Current usage metrics show cumulative count of Article Views (full-text article views including HTML views, PDF and ePub downloads, according to the available data) and Abstracts Views on Vision4Press platform.
Data correspond to usage on the plateform after 2015. The current usage metrics is available 48-96 hours after online publication and is updated daily on week days.
Initial download of the metrics may take a while.