Open Access
Fig. 4
Download original image
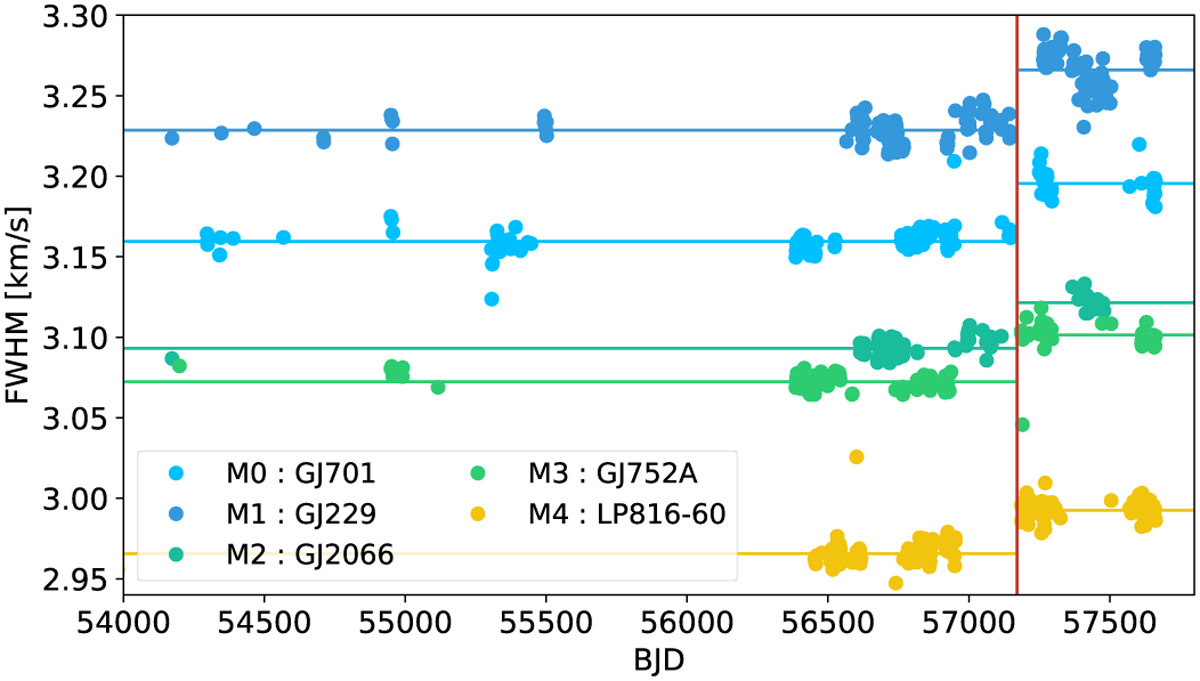
Evolution of the CCF-FWHM for five different spectral subtypes. The red vertical line gives the date (BJD: Barycentric Julian Day) of the fibre change. The horizontal solid lines show the median of the FWHM of the CCF with the M2 mask before and after the fibre change.
Current usage metrics show cumulative count of Article Views (full-text article views including HTML views, PDF and ePub downloads, according to the available data) and Abstracts Views on Vision4Press platform.
Data correspond to usage on the plateform after 2015. The current usage metrics is available 48-96 hours after online publication and is updated daily on week days.
Initial download of the metrics may take a while.