Open Access
Fig. 1
Download original image
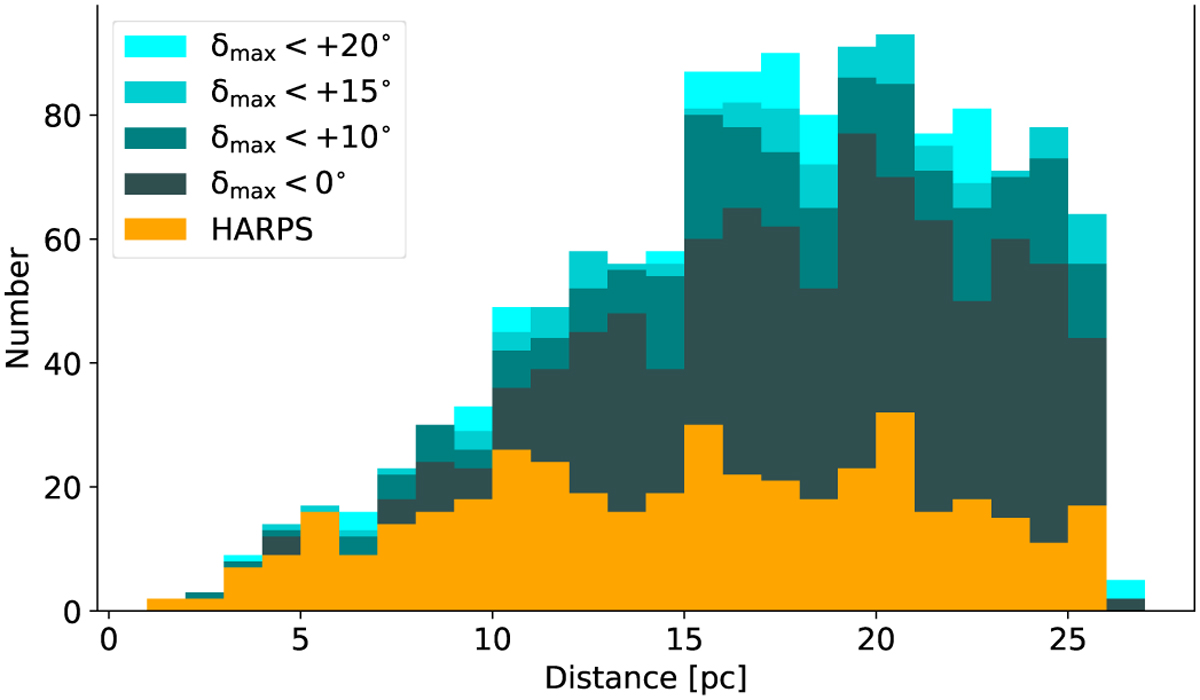
Distance distribution of the sample. In green is the distribution of our reference catalogue for different declination limits. In orange is the distance distribution of the M dwarfs with HARPS measurements.
Current usage metrics show cumulative count of Article Views (full-text article views including HTML views, PDF and ePub downloads, according to the available data) and Abstracts Views on Vision4Press platform.
Data correspond to usage on the plateform after 2015. The current usage metrics is available 48-96 hours after online publication and is updated daily on week days.
Initial download of the metrics may take a while.