Open Access
Fig. 8
Download original image
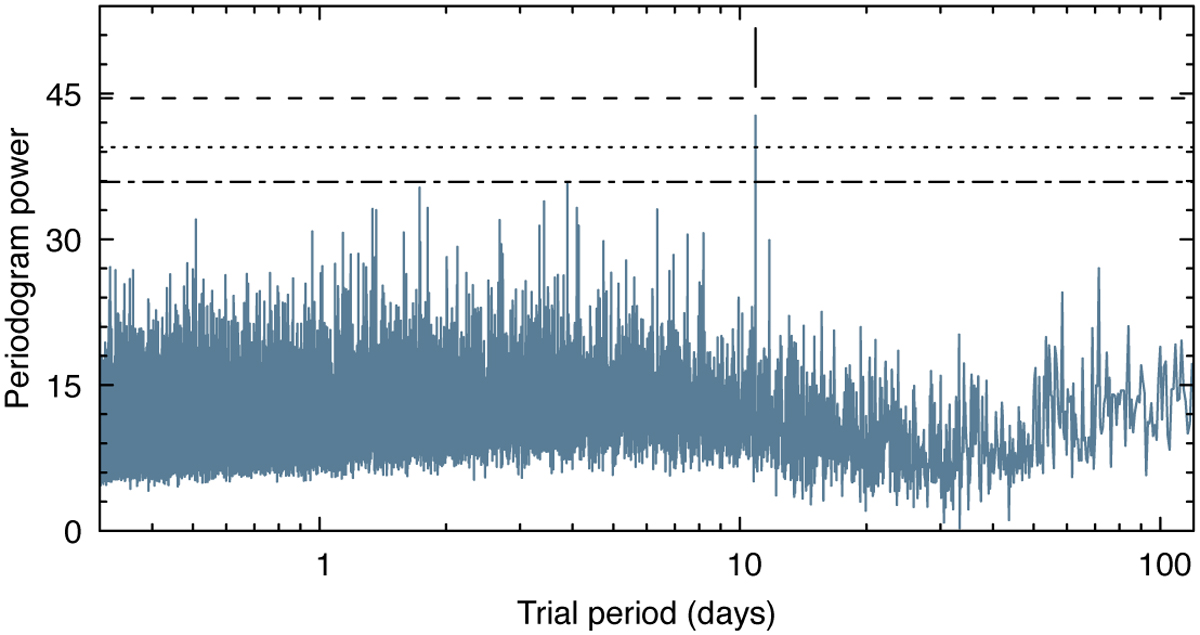
AoVtr periodogram for TESS observations of HD 118203 after cutting out the transits of planet b. A vertical indicator marks the strongest but statistically insignificant peak at 10.9 days. The horizontal lines are the empirical FAP levels of 5, 1, and 0.1% (from the bottom up).
Current usage metrics show cumulative count of Article Views (full-text article views including HTML views, PDF and ePub downloads, according to the available data) and Abstracts Views on Vision4Press platform.
Data correspond to usage on the plateform after 2015. The current usage metrics is available 48-96 hours after online publication and is updated daily on week days.
Initial download of the metrics may take a while.