Fig. 7
Download original image
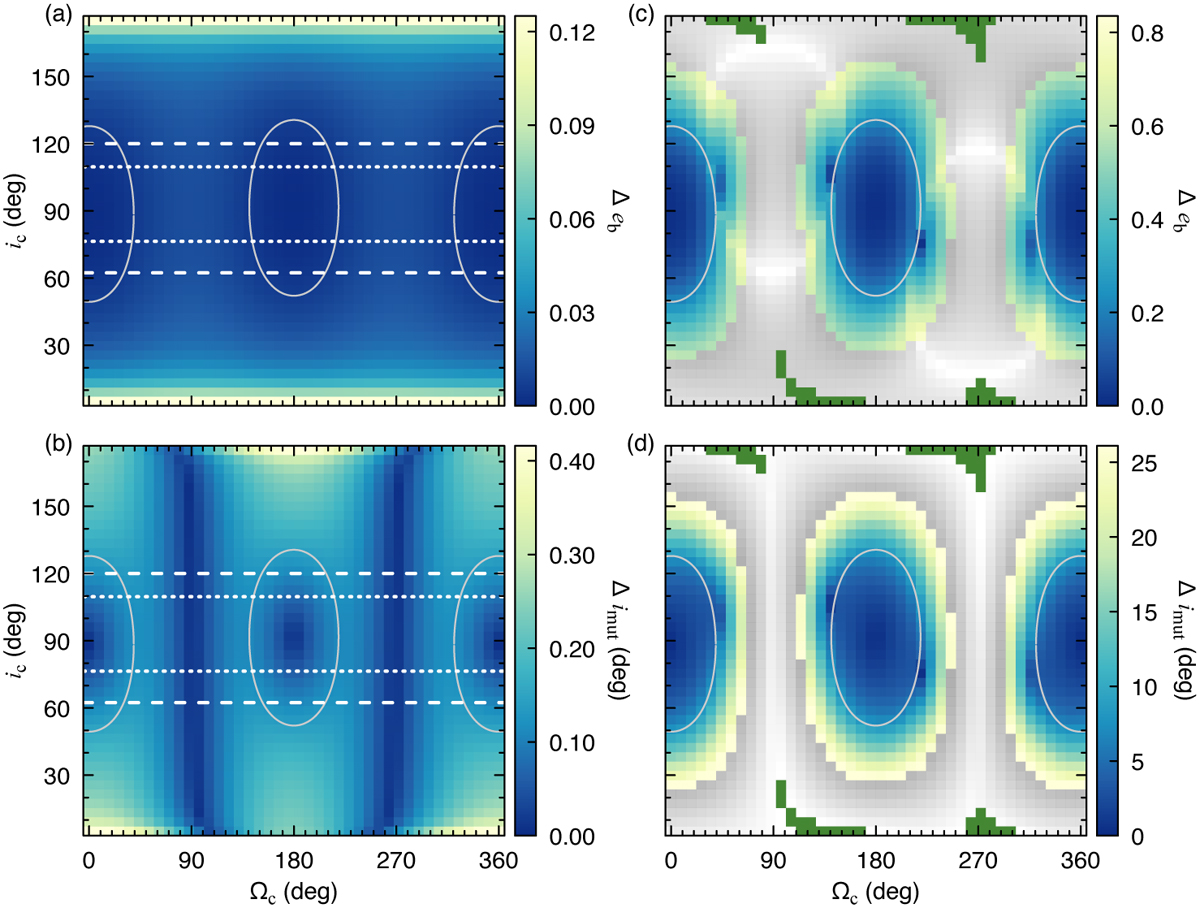
Range of secular variations of eb and imut from numerical simulations iterated for ic and Ωc. Panels a and b were obtained from the model for which the GR and tidal effects were accounted. The values of those variations, Δeb and Δimut, are coded with a colour scale. The horizontal dotted and dashed lines show the 1 and 2 σ ranges of ic constrained from the astrometric observations. The values of imut between the Kozai’s angles are located outside the ovals marked with light grey continuous lines. Panels c and d show the same parameters but for the Newtonian-only model. The simulations leading to unphysical orbits are plotted in greyscale, and those for which we observed orbit flipping from prograde to retrograde or vice versa are marked in green.
Current usage metrics show cumulative count of Article Views (full-text article views including HTML views, PDF and ePub downloads, according to the available data) and Abstracts Views on Vision4Press platform.
Data correspond to usage on the plateform after 2015. The current usage metrics is available 48-96 hours after online publication and is updated daily on week days.
Initial download of the metrics may take a while.