Fig. 4
Download original image
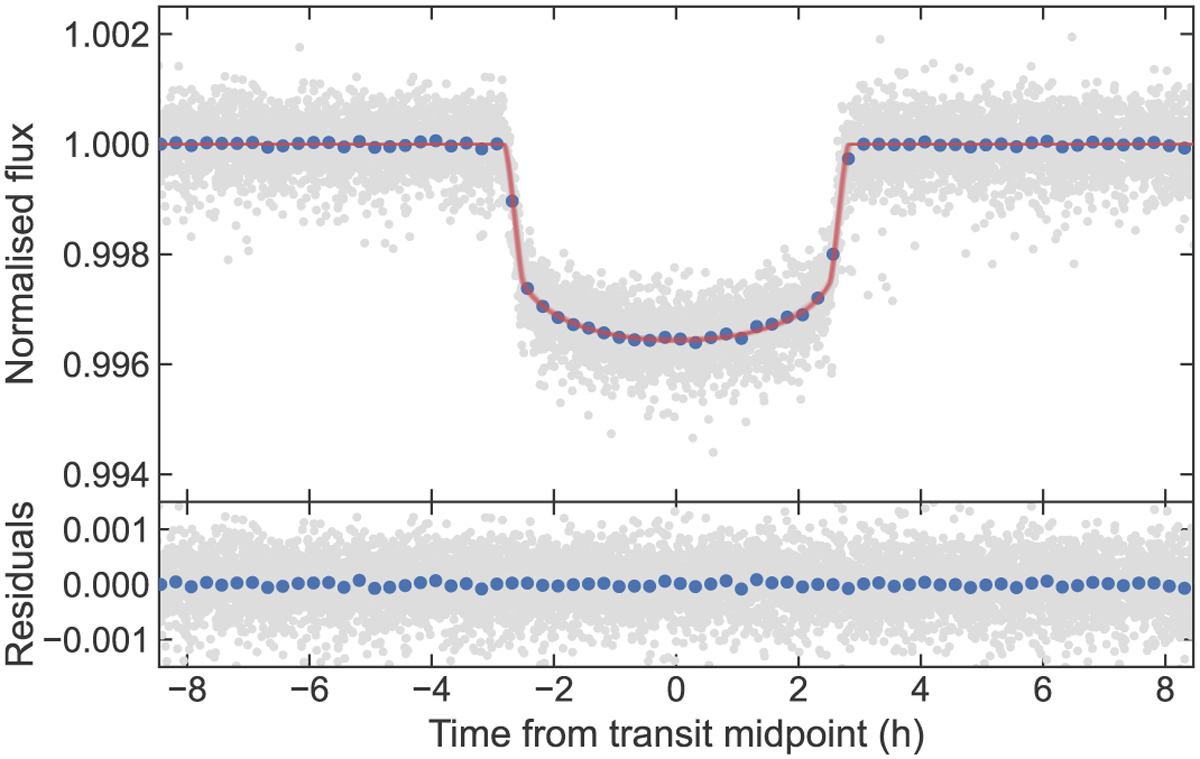
Phase-folded TESS transit light curve for HD 118203 b. Individual measurements are marked with grey points. Blue points show the binned data at 15-minute intervals. The best-fitting model is drawn with a red line. It is blurred with 100 solutions drawn from the posterior samples to reflect the model uncertainties. The residuals are plotted below.
Current usage metrics show cumulative count of Article Views (full-text article views including HTML views, PDF and ePub downloads, according to the available data) and Abstracts Views on Vision4Press platform.
Data correspond to usage on the plateform after 2015. The current usage metrics is available 48-96 hours after online publication and is updated daily on week days.
Initial download of the metrics may take a while.