Fig. 2
Download original image
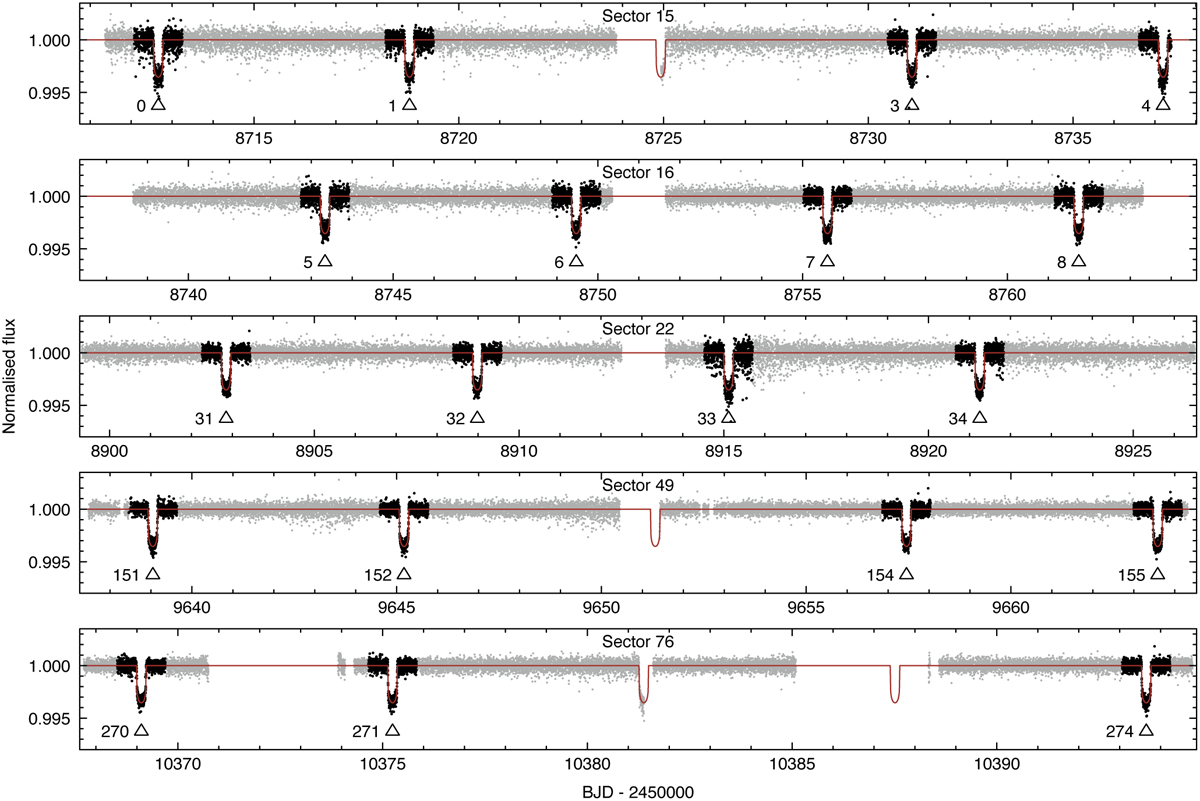
TESS photometric time series extracted for HD 118203. Grey points mark all measurements. The chunks considered in transit modelling for planet b are plotted with black points. The transits are numbered starting from the reference epoch given by Pepper et al. (2020). The red lines sketch the best-fitting transit model derived in Sec. 3.2.
Current usage metrics show cumulative count of Article Views (full-text article views including HTML views, PDF and ePub downloads, according to the available data) and Abstracts Views on Vision4Press platform.
Data correspond to usage on the plateform after 2015. The current usage metrics is available 48-96 hours after online publication and is updated daily on week days.
Initial download of the metrics may take a while.