Fig. 9
Download original image
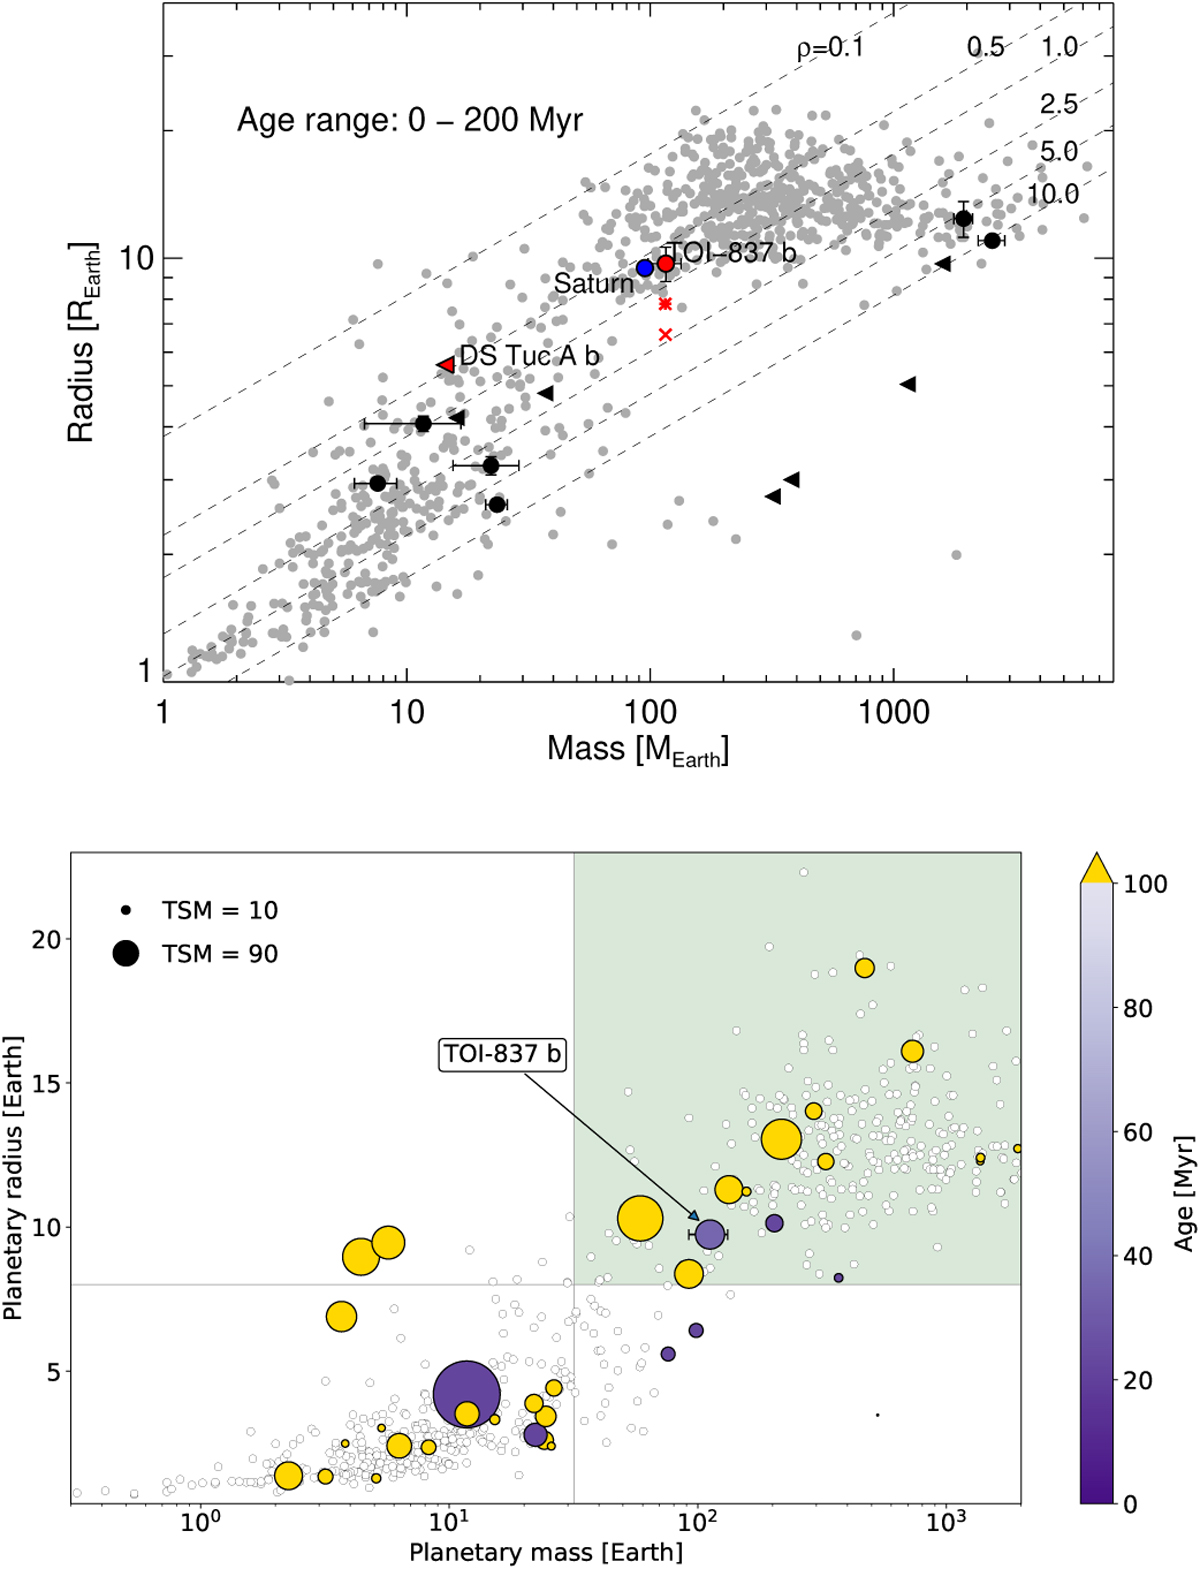
Mass–radius diagram for a comparison between planets younger than 200 Myr and a mature population, and for assessing the prospects for a follow-up of TOI-837 b with JWST. Upper panel: mass-radius diagrams showing transiting planets with ages of less than 200 Myr (black symbols), taking the upper uncertainties on age into account for the definition of the age bin. Black dots indicate planets with a measured mass, while black triangles represent planets for which only an upper limit on mass is available. Grey dots represent a sample of older planets for which masses and radii have been measured with a precision of at least 30% and 10%, respectively. The current location of the planet TOI-837 b is indicated with a red dot, while the red asterisk and cross symbols denote the expected locations at an age of 1 Gyr for the cases of rock-ice core+low atmospheric opacity and rock-iron core+high atmospheric opacity, respectively (see Table 4 and Sect. 5.2 for details). A red triangle indicates the location of the planet DS Tuc Ab (1σ mass upper limit; Benatti et al. 2021). Saturn is identified by a blue dot. Diagonal dashed lines indicate the locations of planets with an equal density. Lower panel: mass–radius diagram of planets younger than 200 Myr, with dot size representing the TSM metrics for prospects of spectro-scopic follow-up with JWST. The mass of the planets is shown on a logarithmic scale. The giant planets (Rp > 8 R⊕ and Mp > 0.1 MJ) are represented within the light green area.
Current usage metrics show cumulative count of Article Views (full-text article views including HTML views, PDF and ePub downloads, according to the available data) and Abstracts Views on Vision4Press platform.
Data correspond to usage on the plateform after 2015. The current usage metrics is available 48-96 hours after online publication and is updated daily on week days.
Initial download of the metrics may take a while.