Fig. 7
Download original image
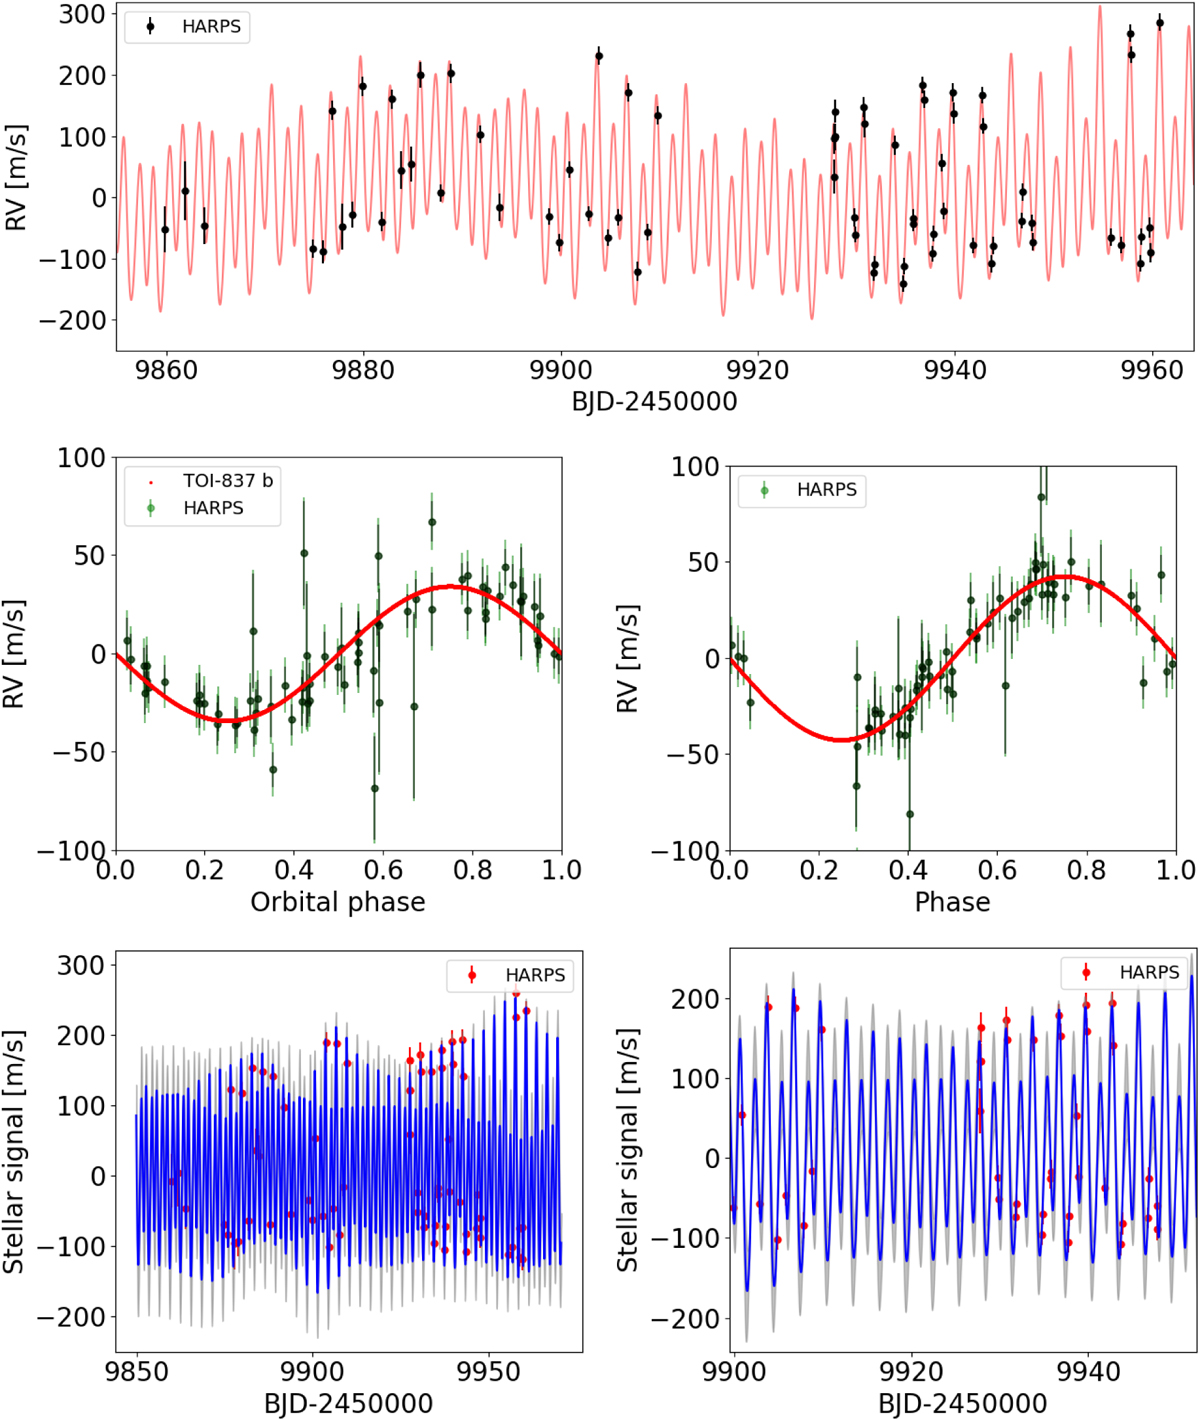
Best-fit models related to the RV dataset obtained from the joint RV+light curve analysis described in Sect. 4.3. First row: RV time series with the adopted best-fit model over-plotted (red curve; activity plus Doppler signal due to TOI-837 b). Second row: phase-folded Doppler RV signal of TOI-837 due to planet b (left panel), and the signal with a period of ∽ 74 days, which we interpret as due to stellar activity (right panel). Nominal error bars are indicated in black, while the error bars with an uncorrelated jitter term added in quadrature are indicated in green. Third row: stellar-activity-correlated signal in the RV time series (red dots) as fitted by a GP regression including the sum of two quasi-periodic kernels. The blue line represents the best-fit model, and the 1σ confidence interval is shown as a shaded grey area. The panel on the right is a zoomed-in view of the left panel, for better readability. To calculate all the theoretical curves shown here, we adopted the median values of the model parameters in Table 2.
Current usage metrics show cumulative count of Article Views (full-text article views including HTML views, PDF and ePub downloads, according to the available data) and Abstracts Views on Vision4Press platform.
Data correspond to usage on the plateform after 2015. The current usage metrics is available 48-96 hours after online publication and is updated daily on week days.
Initial download of the metrics may take a while.