Fig. 5
Download original image
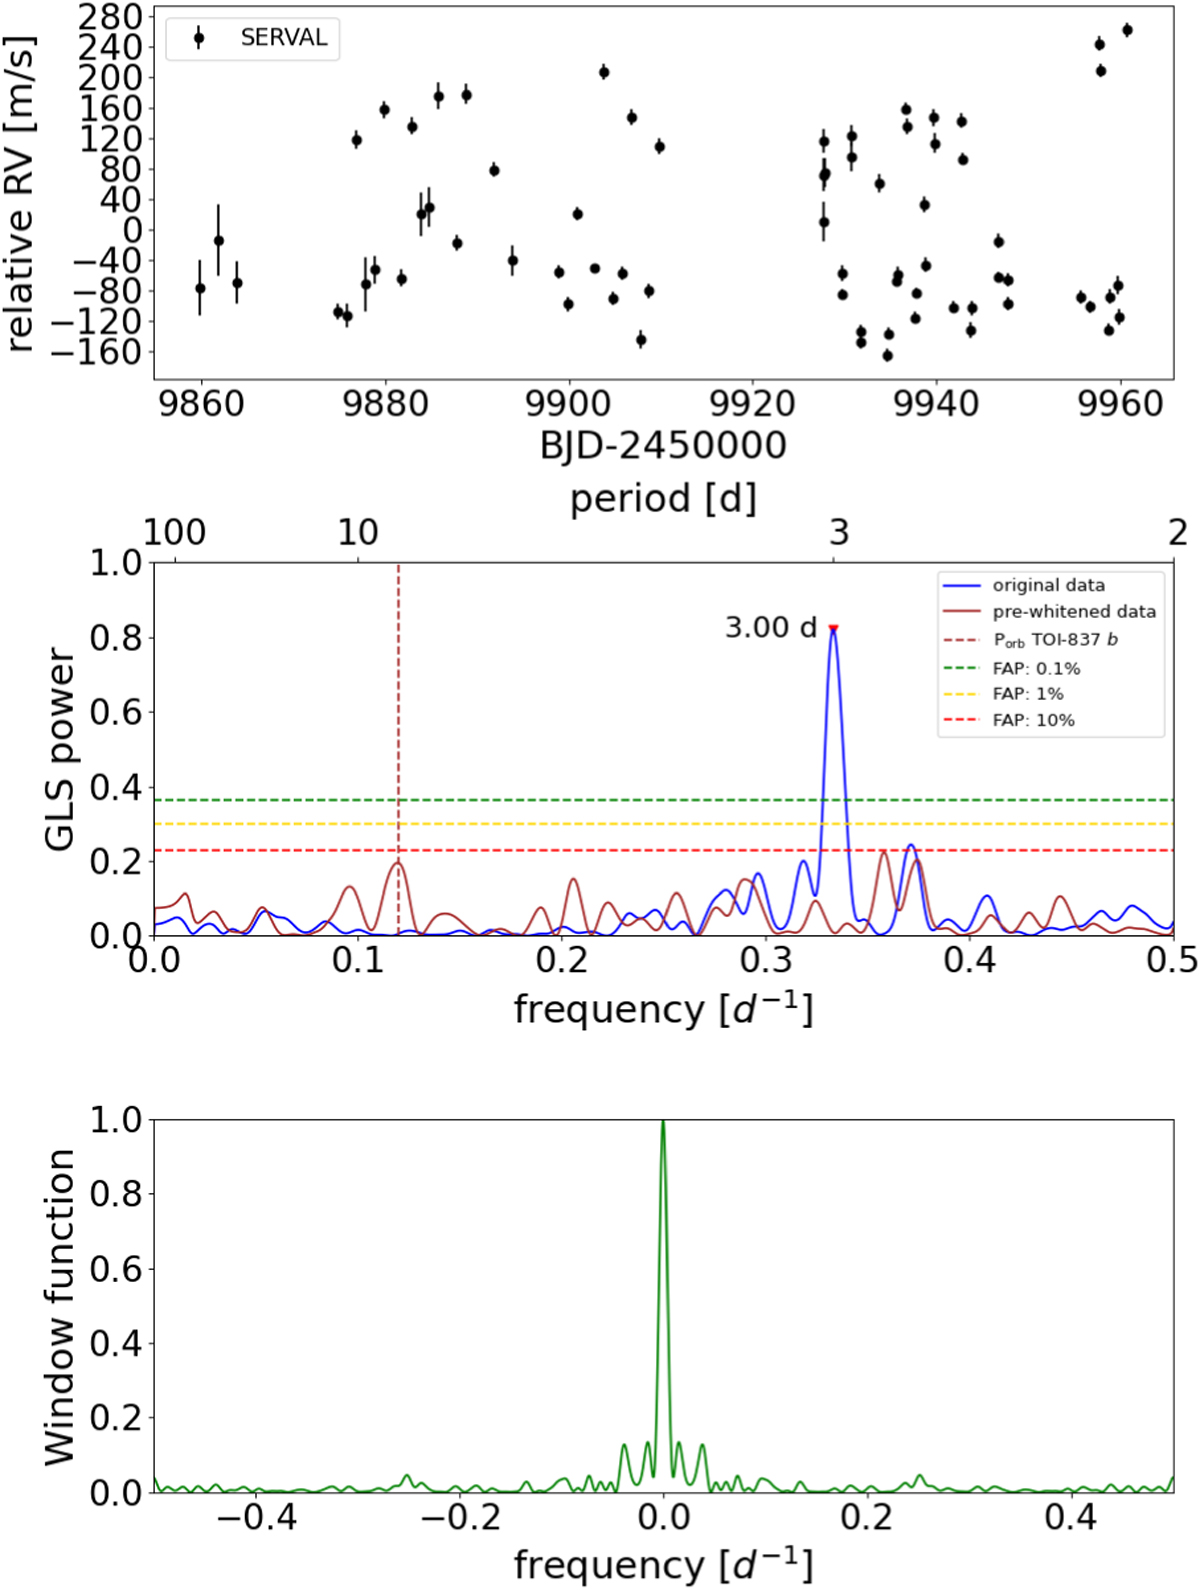
Time series and periodogram of the HARPS RVs. Upper panel: RV time series of TOI-837 (SERVAL extraction). Middle panel: GLS periodogram of the original and prewhitened data. False-alarm probability levels for the periodogram of the original RV dataset are indicated by horizontal dashed lines. Lower panel: window function of the data.
Current usage metrics show cumulative count of Article Views (full-text article views including HTML views, PDF and ePub downloads, according to the available data) and Abstracts Views on Vision4Press platform.
Data correspond to usage on the plateform after 2015. The current usage metrics is available 48-96 hours after online publication and is updated daily on week days.
Initial download of the metrics may take a while.