Fig. 2
Download original image
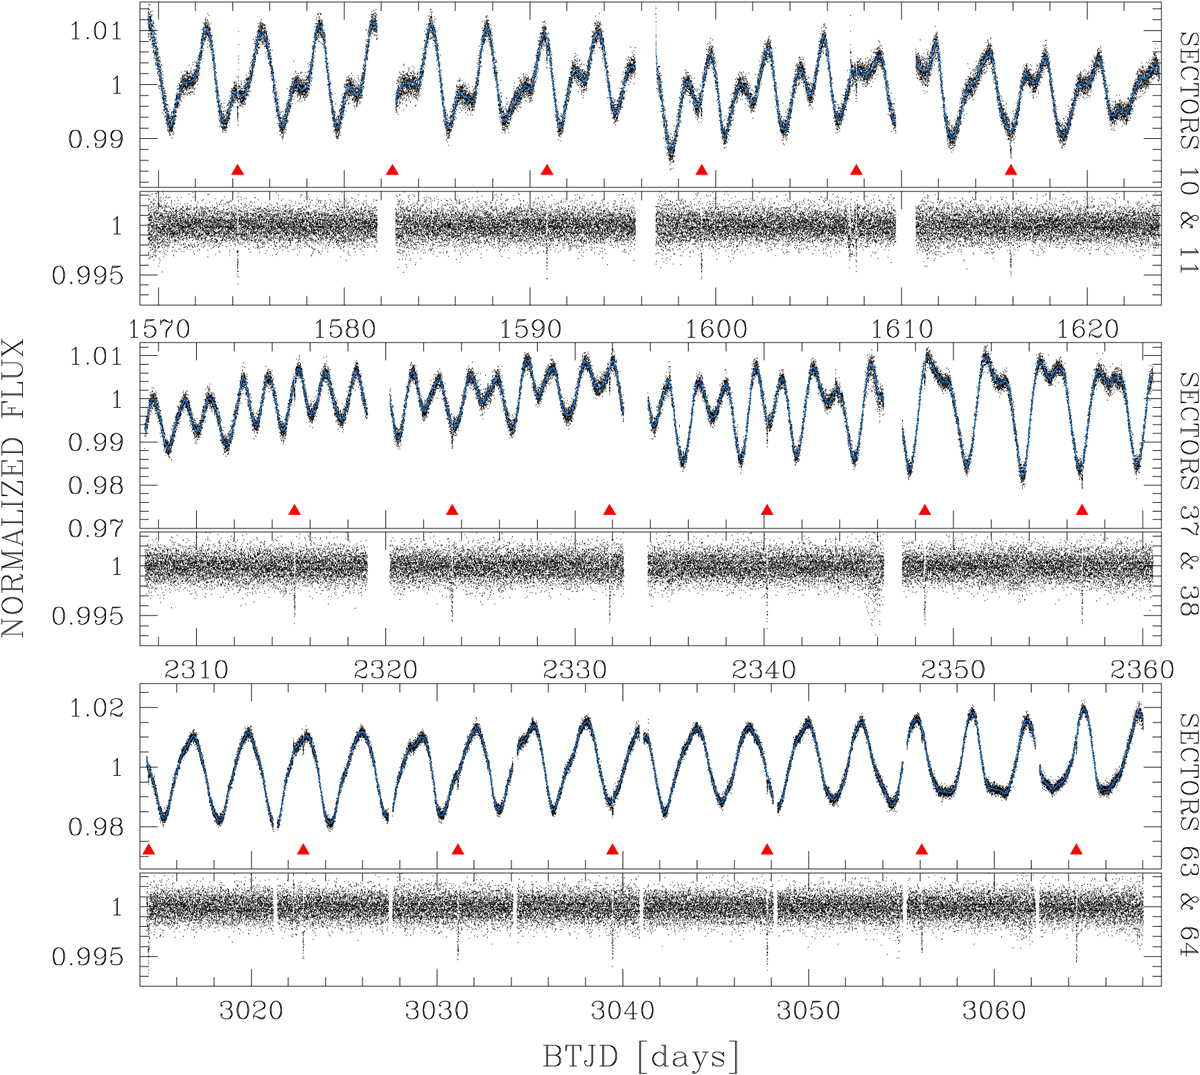
Short-cadence lightcurves of TOI-837 observed by TESS in Sectors 10 and 11 (top panel), 37 and 38 (middle panel), and 63 and 64 (bottom panel). For each pair of sectors, we report the short-cadence light curve and the detrending model (in azure), and the corresponding flattened light curve. The transits of TOI-837 b are indicated with red triangles.
Current usage metrics show cumulative count of Article Views (full-text article views including HTML views, PDF and ePub downloads, according to the available data) and Abstracts Views on Vision4Press platform.
Data correspond to usage on the plateform after 2015. The current usage metrics is available 48-96 hours after online publication and is updated daily on week days.
Initial download of the metrics may take a while.