Fig. 15
Download original image
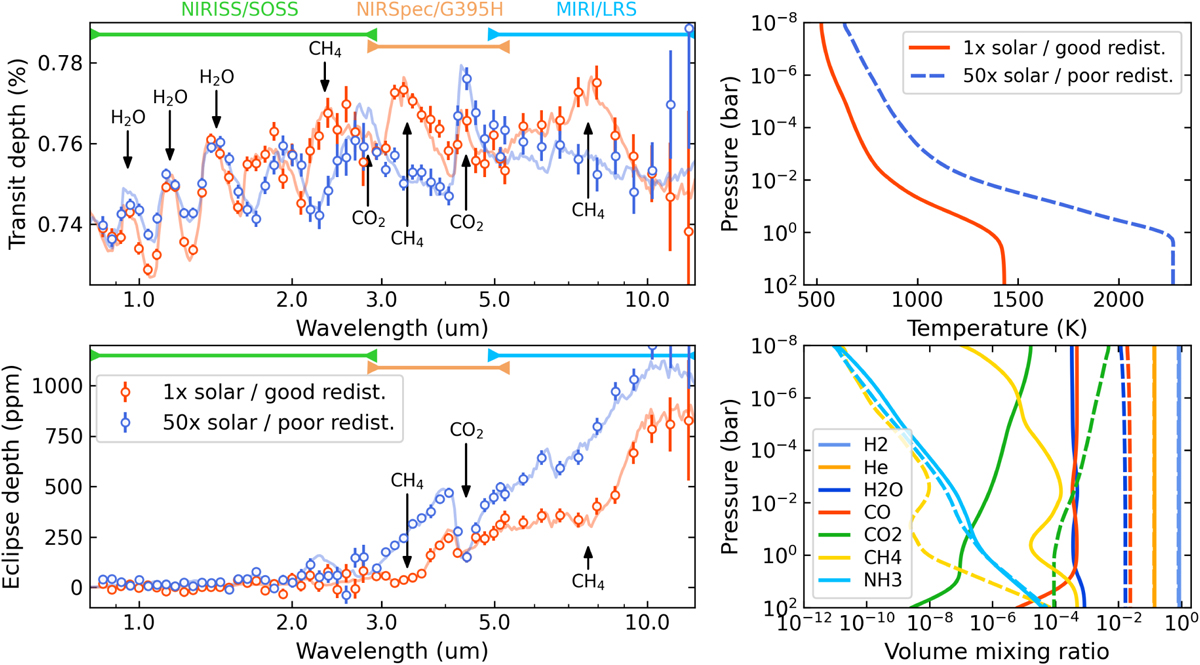
JWST observation simulations of TOI-837 b. Left panels: transit (top) and eclipse (bottom) simulations of JWST spectra for two scenarios: a solar-metallicity atmosphere with efficient day–night energy redistribution (red) and a 50× solar-metallicity atmosphere with poor energy redistribution (blue). The markers with error bars show one realisation of an observation with the expected uncertainties (assuming a single observation per instrument). The coloured labels at the top denote the instrument and spectral range of the simulated observations. The solid curves denote the underlying ‘true’ astrophysical models. The main molecular bands discussed in the text are indicated. Top-right panel: radiative-thermochemical-equilibrium temperature profiles, which are the basis for the simulations and atmospheric modelling. Bottom-right panel: atmospheric abundances for the 1 × (solid curves) and 50× solar metallicity model (dashed curves) for selected species (see legend).
Current usage metrics show cumulative count of Article Views (full-text article views including HTML views, PDF and ePub downloads, according to the available data) and Abstracts Views on Vision4Press platform.
Data correspond to usage on the plateform after 2015. The current usage metrics is available 48-96 hours after online publication and is updated daily on week days.
Initial download of the metrics may take a while.