Fig. 10
Download original image
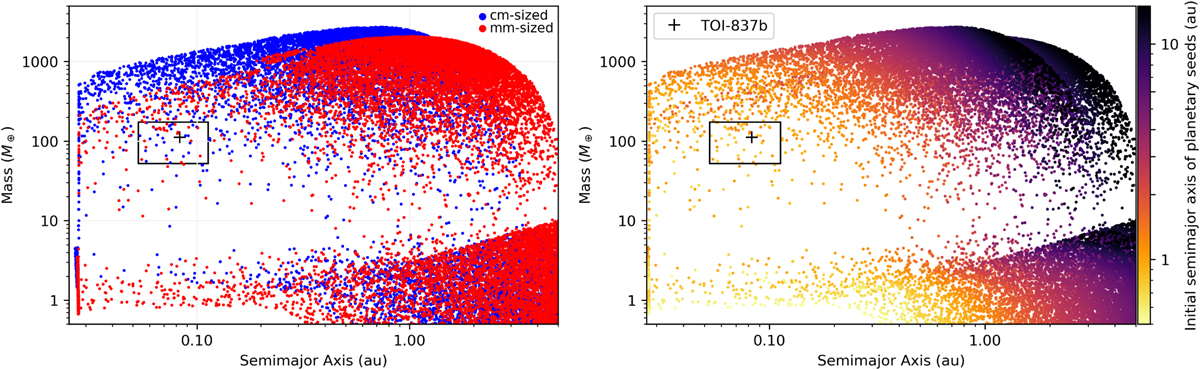
Synthetic planetary populations resulting from the Monte Carlo runs of the GroMiT code, plotted in the final mass–final semimajor axis space. The cross indicates the median mass and semimajor axis of TOI-837 b, while the box shows the associated 3σ range of the planetary mass and semimajor axis. Left: results for both mm-sized (red) and cm-sized (blue) pebbles. Right: same as in the left panel, but including a colour scale to indicate the initial semimajor axes of the planetary seeds.
Current usage metrics show cumulative count of Article Views (full-text article views including HTML views, PDF and ePub downloads, according to the available data) and Abstracts Views on Vision4Press platform.
Data correspond to usage on the plateform after 2015. The current usage metrics is available 48-96 hours after online publication and is updated daily on week days.
Initial download of the metrics may take a while.