Fig. 2
Download original image
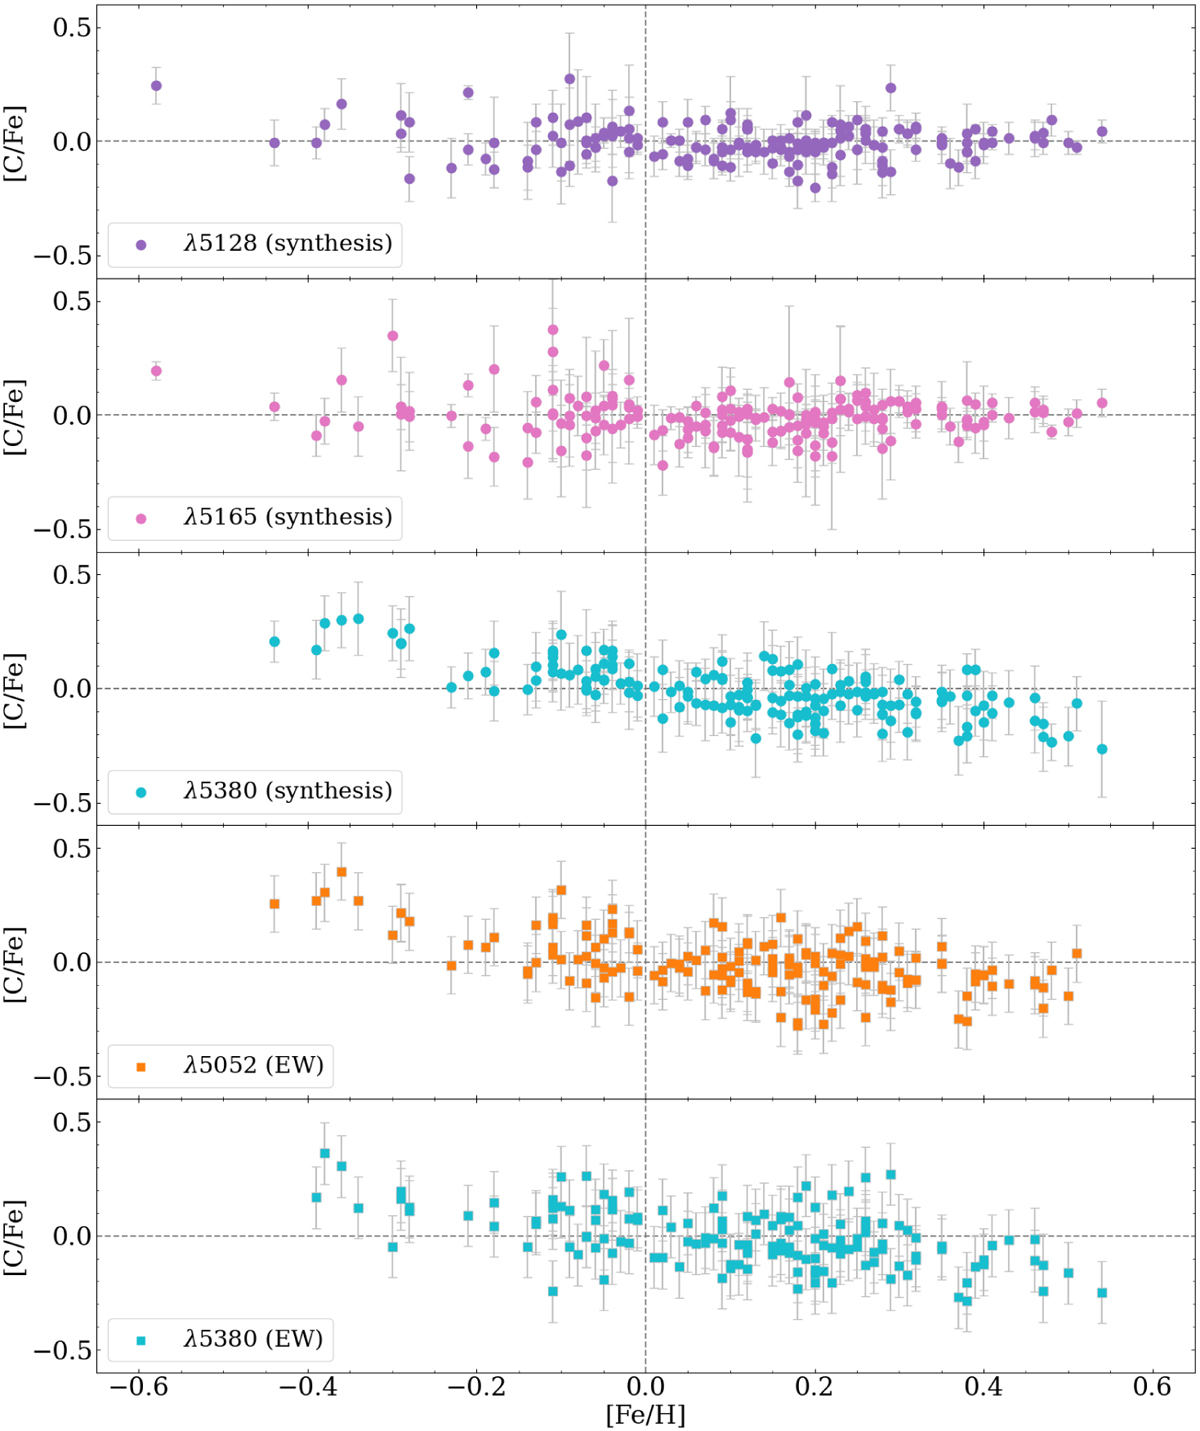
[C/Fe] abundance ratios as a function of the stellar metallicity. The panels show the carbon abundances derived from the spectral synthesis (circles) of two molecular bands (5128 and 5165 Å) and one atomic line (5380.3 Å) and from the equivalent widths (squares) of two atomic lines (5052.2 and 5380.3 Å). Stars cooler than 5000 K for 5052.2 Å (EW) and than 5200 K for 5380.3 Å (EW) are not plotted (see the discussion in Appendix A).
Current usage metrics show cumulative count of Article Views (full-text article views including HTML views, PDF and ePub downloads, according to the available data) and Abstracts Views on Vision4Press platform.
Data correspond to usage on the plateform after 2015. The current usage metrics is available 48-96 hours after online publication and is updated daily on week days.
Initial download of the metrics may take a while.