Fig. C.1
Download original image
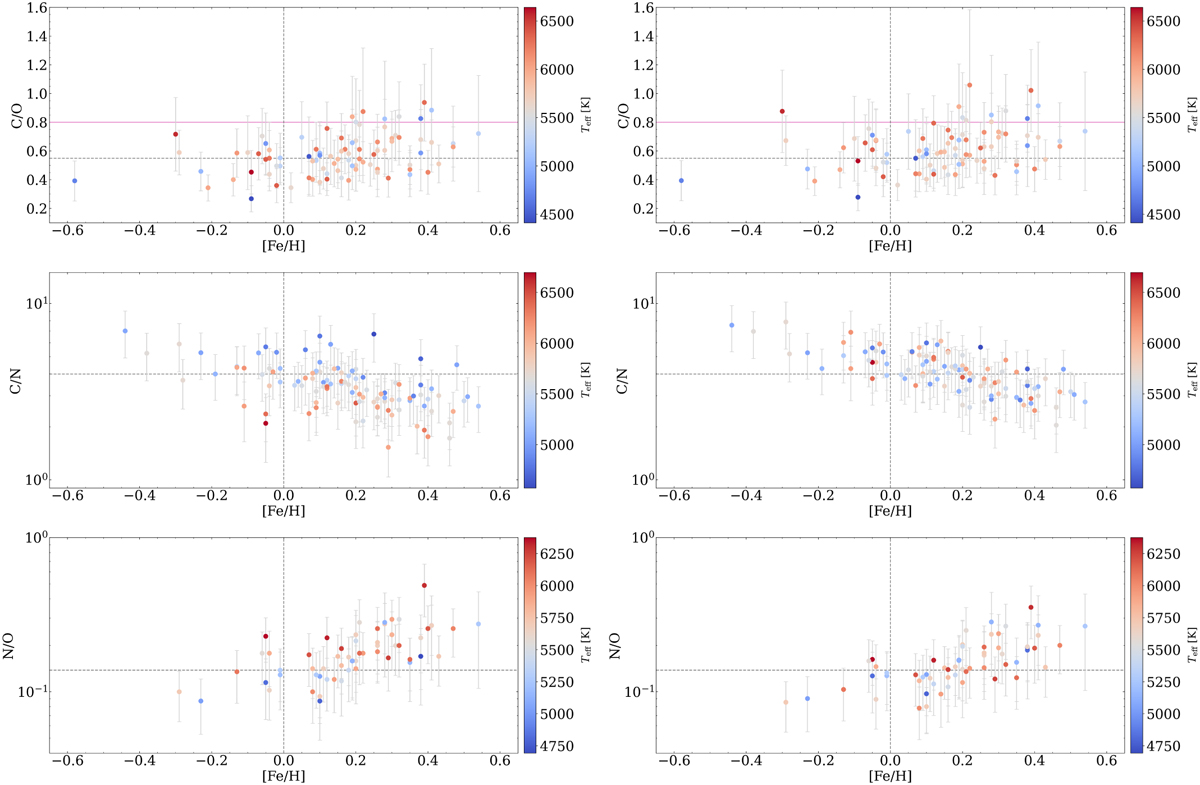
Abundance ratios as a function of the stellar metallicity colour coded according to the stellar effective temperature. The panels show the X1/X2 elemental ratios calculated before (left) and after (right) correcting the abundances from the trends with Teff (see discussion in the text). The black dashed lines indicate the solar values and the magenta solid line represents the lower limit of C/O = 0.8 for carbon-rich stars.
Current usage metrics show cumulative count of Article Views (full-text article views including HTML views, PDF and ePub downloads, according to the available data) and Abstracts Views on Vision4Press platform.
Data correspond to usage on the plateform after 2015. The current usage metrics is available 48-96 hours after online publication and is updated daily on week days.
Initial download of the metrics may take a while.