Fig. B.1
Download original image
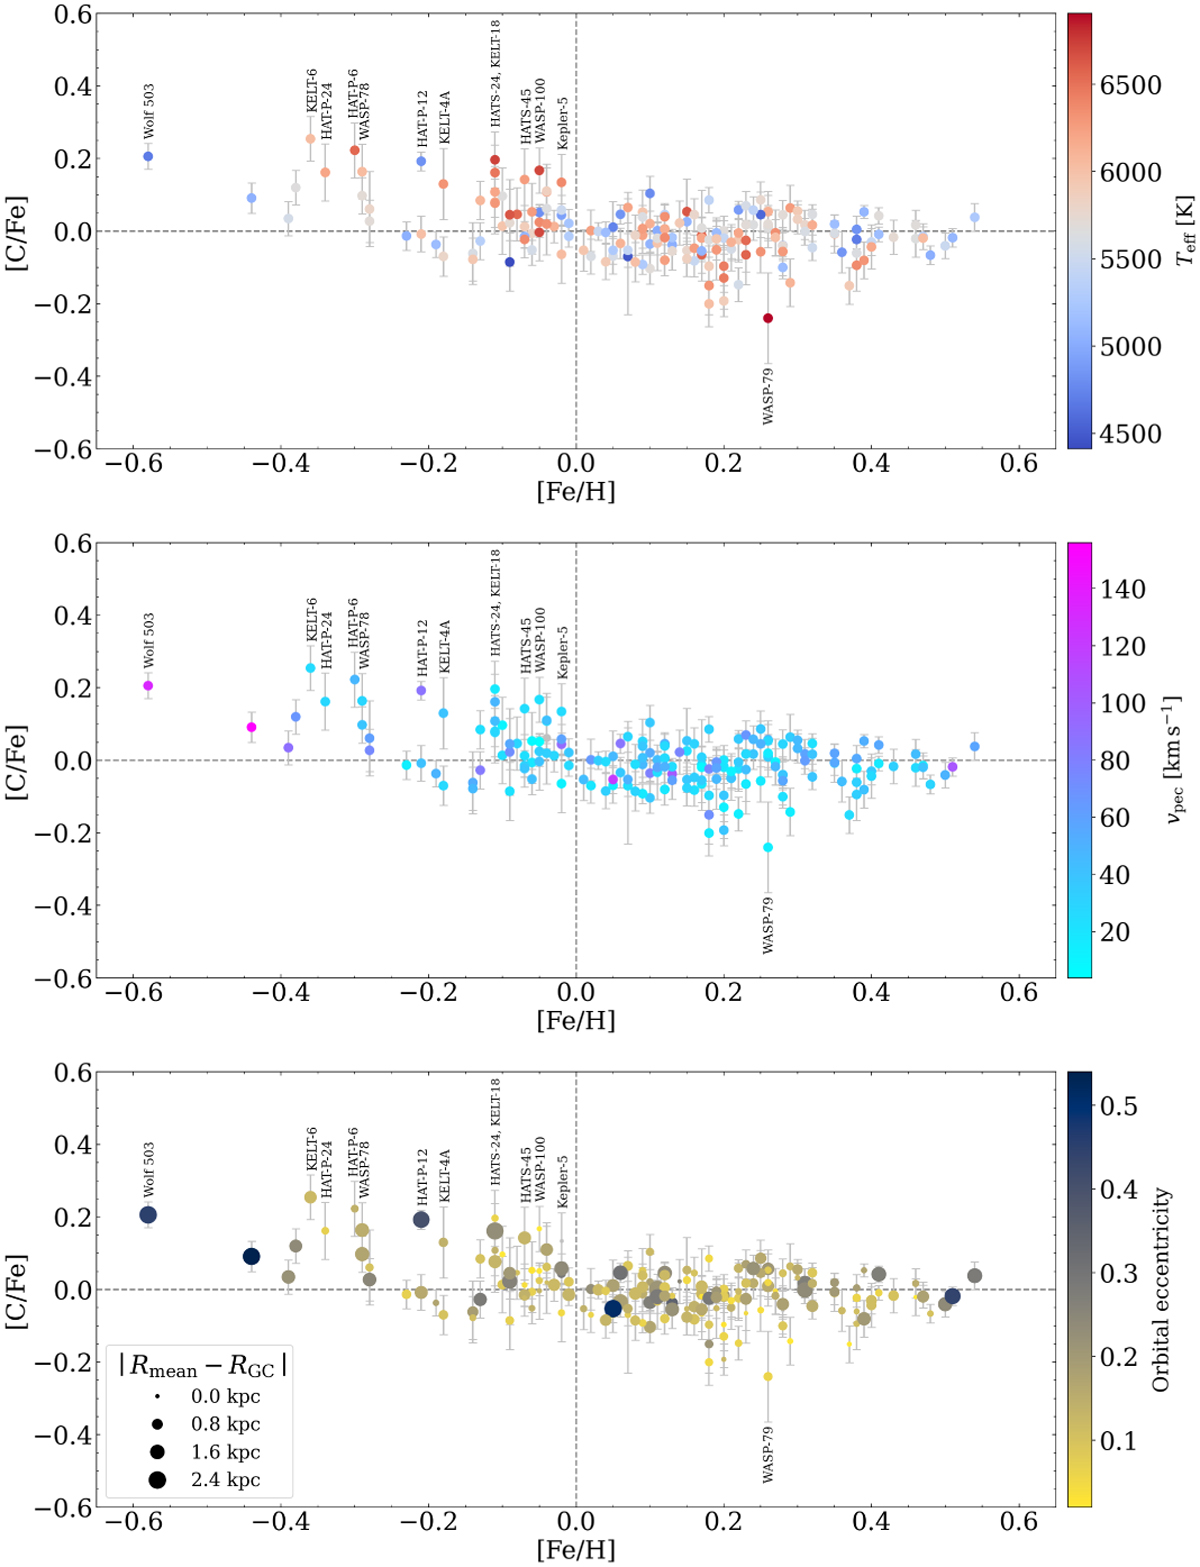
Mean [C/Fe] abundance ratios as a function of the stellar metallicity. Same as in Fig. 4 but showing our stars colour-coded according to their effective temperature (top panel), peculiar space velocity (middle panel), and orbital eccentricity (bottom panel) from Magrini et al. (2022). In the bottom panel, the symbol sizes are proportional to the difference between the mean distance of the stars in their Galactic orbit (Rmean) and their current galactocentric distance (RGC).
Current usage metrics show cumulative count of Article Views (full-text article views including HTML views, PDF and ePub downloads, according to the available data) and Abstracts Views on Vision4Press platform.
Data correspond to usage on the plateform after 2015. The current usage metrics is available 48-96 hours after online publication and is updated daily on week days.
Initial download of the metrics may take a while.