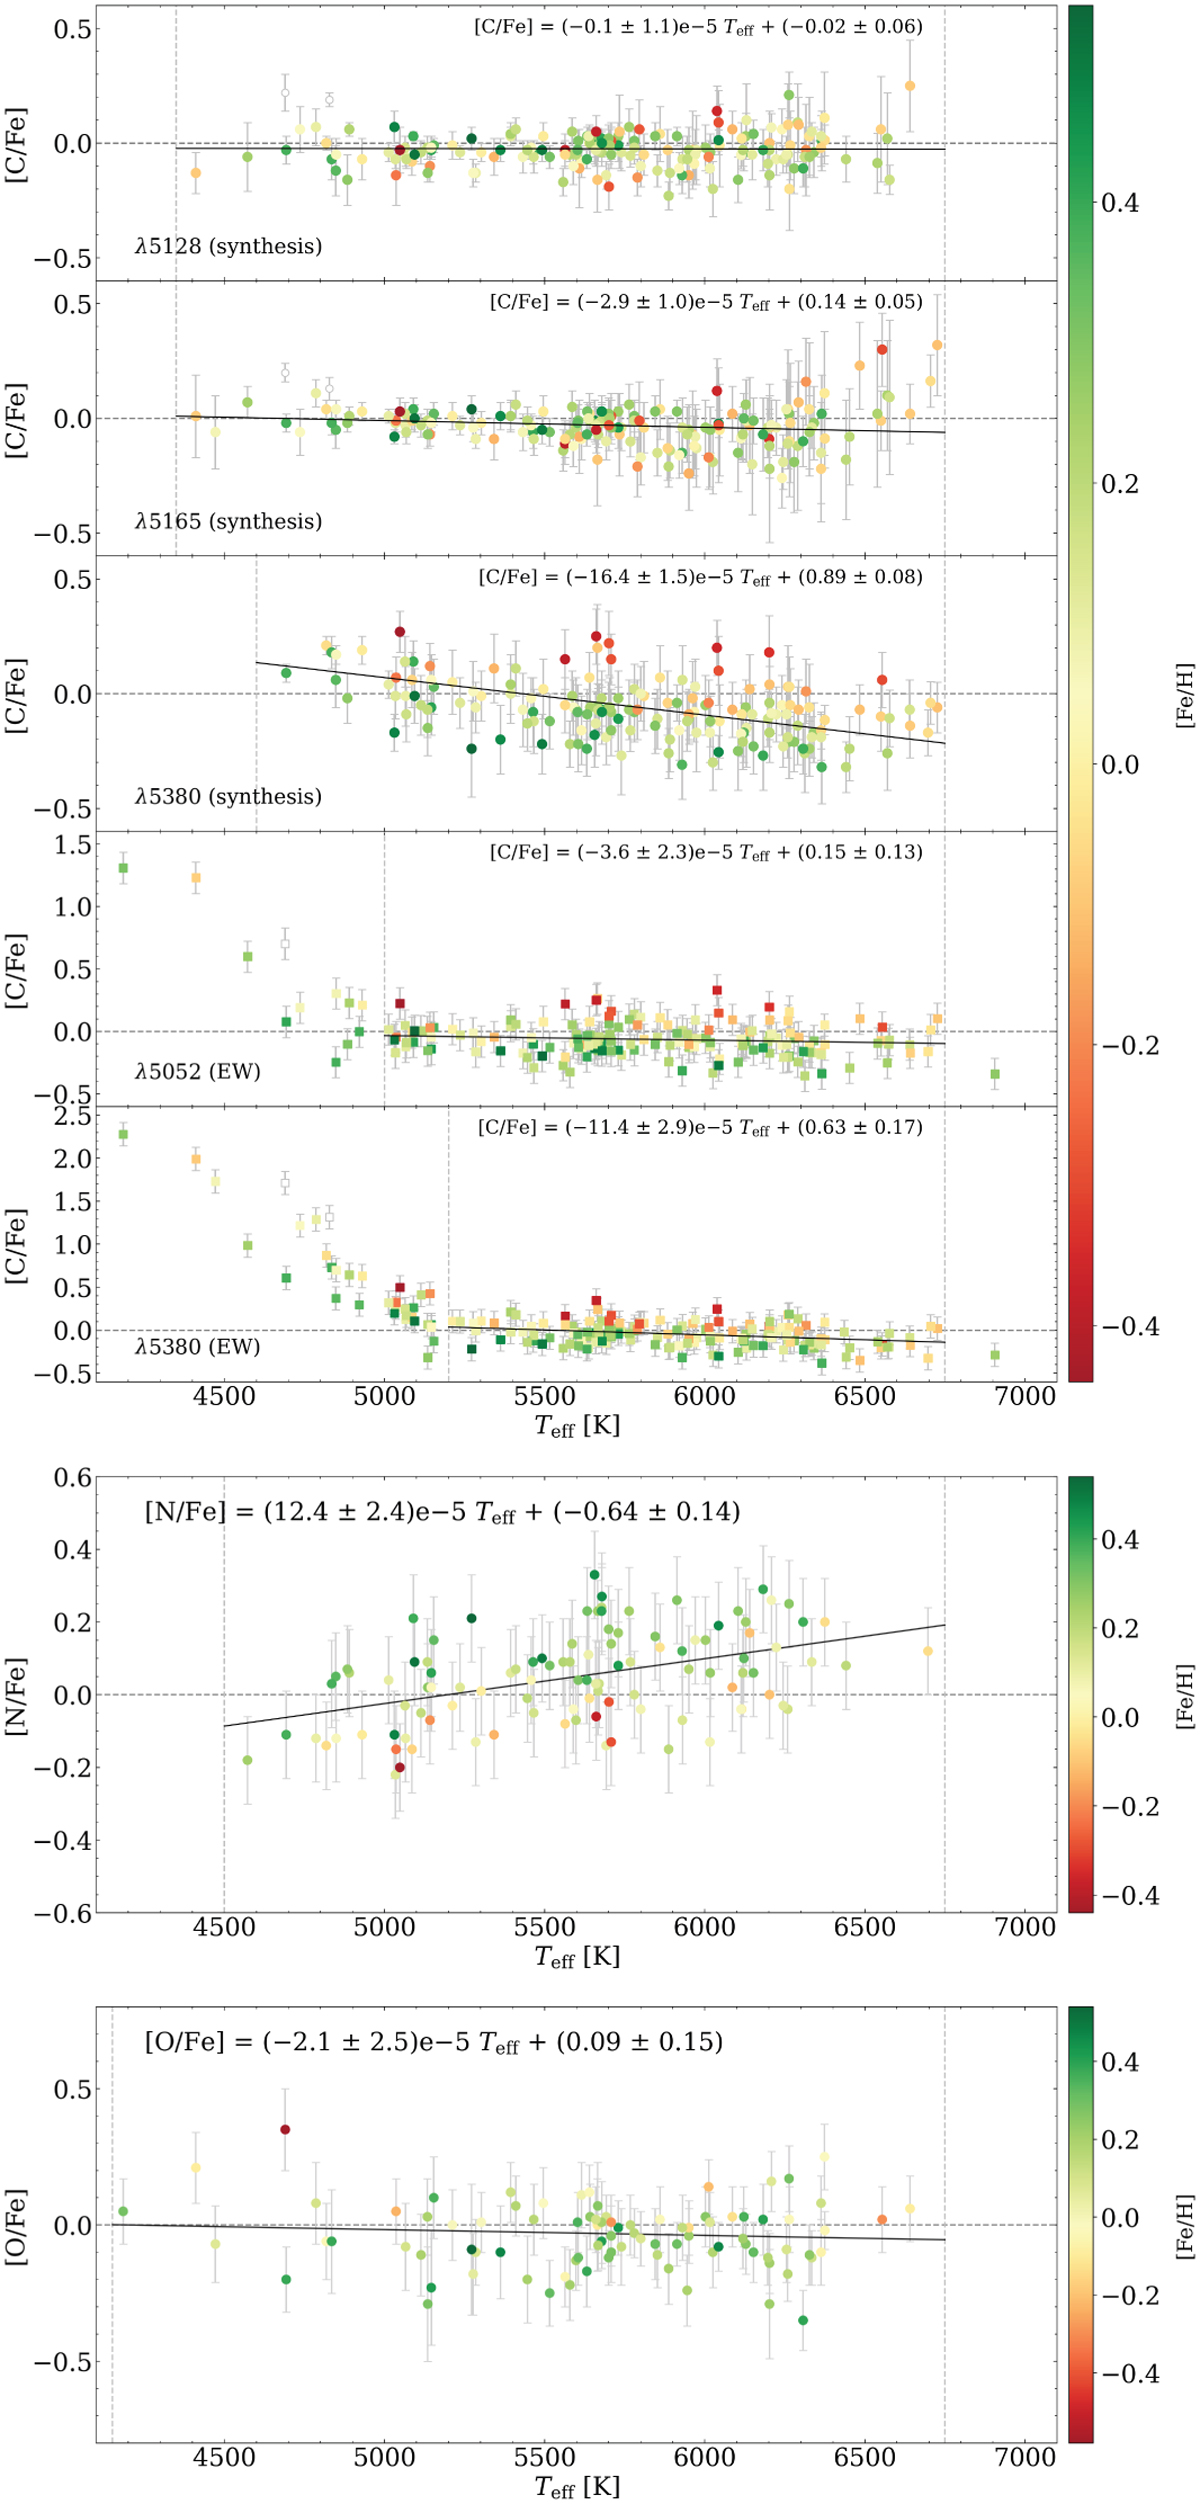
Fig. A.1
Download original image
Abundance ratios as a function of the effective temperature colour coded according to the stellar metallicity. The white symbols indicate two stars that most likely belong to the thick-disc population. The black lines display linear regressions fitted to stars within a given Teff range (delimited by the vertical dashed lines). The corresponding equations are also shown.
Current usage metrics show cumulative count of Article Views (full-text article views including HTML views, PDF and ePub downloads, according to the available data) and Abstracts Views on Vision4Press platform.
Data correspond to usage on the plateform after 2015. The current usage metrics is available 48-96 hours after online publication and is updated daily on week days.
Initial download of the metrics may take a while.