Fig. 1
Download original image
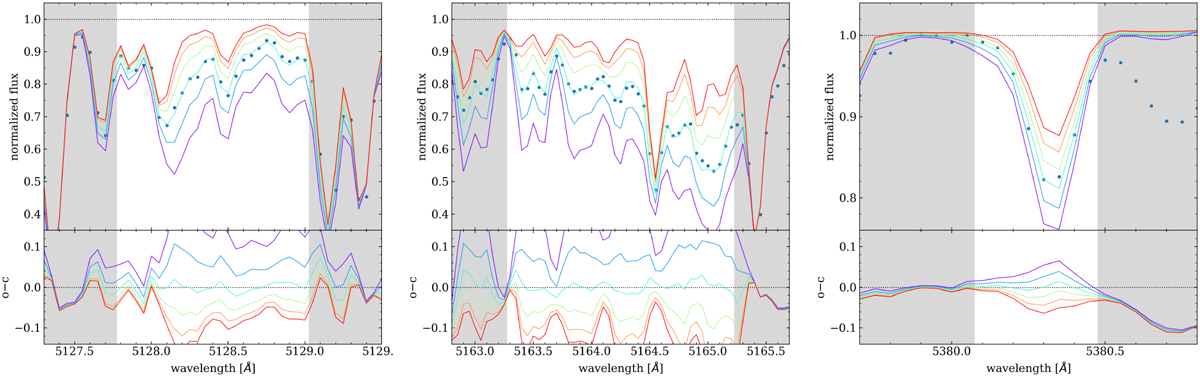
Spectral synthesis examples. The panels show the C2 molecular band regions at 5128 Å (left) and 5165 Å (middle), and the C I atomic line at 5380.3 Å (right) for the HARPS spectrum of K2-24 (S/N ~ 50 at 5000 Å, Teff = 5768 K, [Fe/H] = 0.41). The blue dots represent the observed spectrum, and the coloured lines are the synthetic spectra fitted to the data for models with different C abundances, separated by 0.1 dex. The bottom panels show the differences between observed and computed spectra. The shaded regions indicate wavelengths not used in the fit.
Current usage metrics show cumulative count of Article Views (full-text article views including HTML views, PDF and ePub downloads, according to the available data) and Abstracts Views on Vision4Press platform.
Data correspond to usage on the plateform after 2015. The current usage metrics is available 48-96 hours after online publication and is updated daily on week days.
Initial download of the metrics may take a while.