Open Access
Fig. 7
Download original image
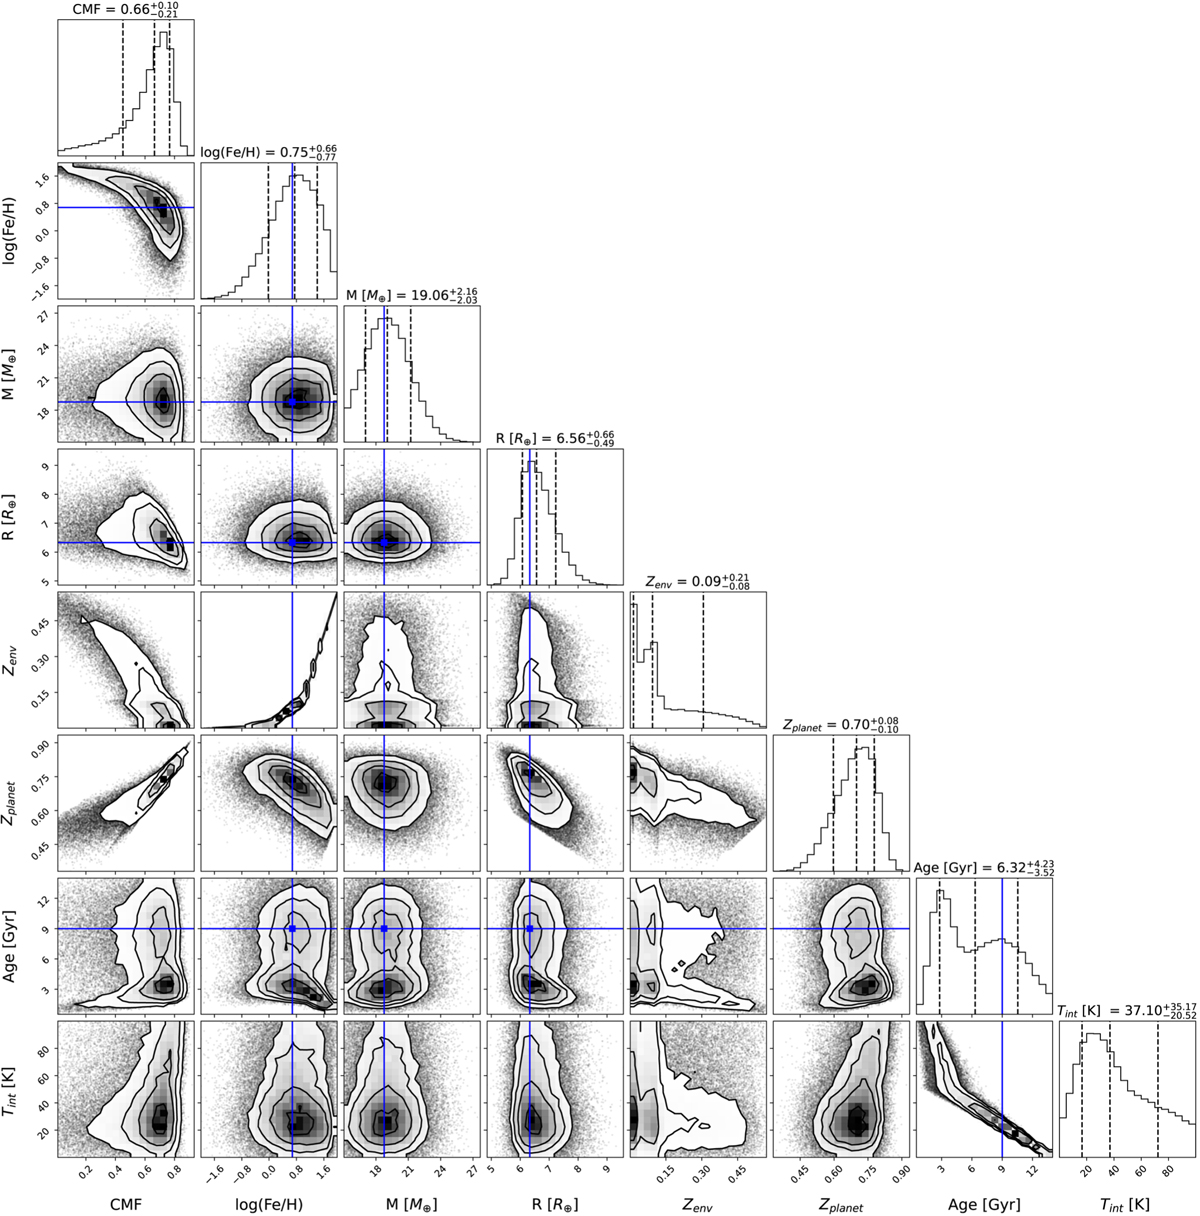
2D and 1D marginalized posterior distribution functions for our MCMC retrieval on HAT-P-26 b data. Blue lines indicate the mean value of the observed data for the mass, radius, atmospheric metallicity, and age. Black lines in the 2D distributions indicate the 1, 2, and 3 σ regions.
Current usage metrics show cumulative count of Article Views (full-text article views including HTML views, PDF and ePub downloads, according to the available data) and Abstracts Views on Vision4Press platform.
Data correspond to usage on the plateform after 2015. The current usage metrics is available 48-96 hours after online publication and is updated daily on week days.
Initial download of the metrics may take a while.