Fig. 2
Download original image
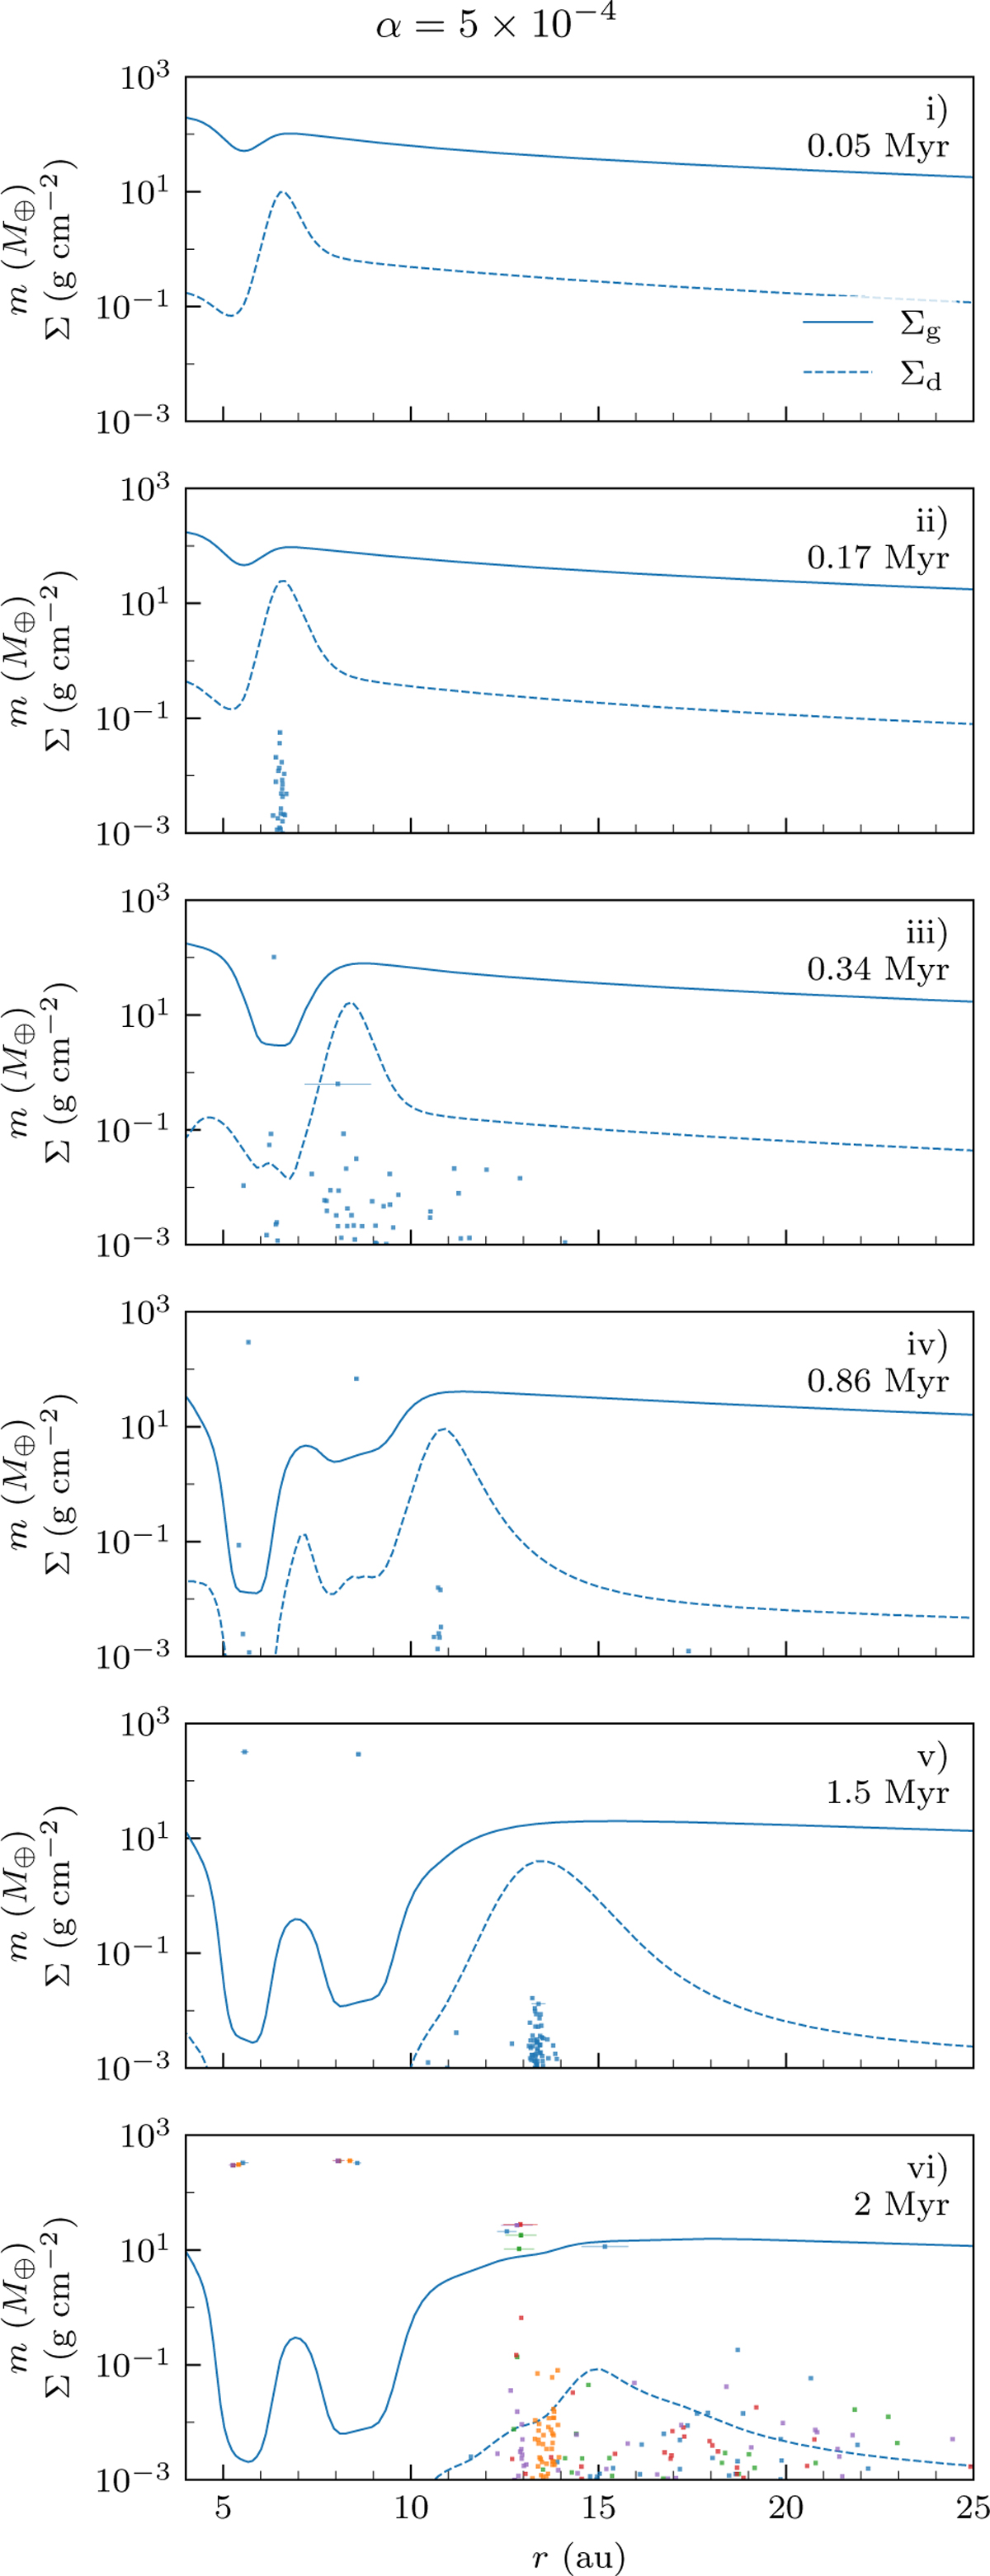
Six key timestamps demonstrating sequential planet formation in one of the simulations with α = 5 × 10⁻⁴. Each panel shows the radial profiles of the gas surface density ∑g (solid line), the dust surface density ∑d (dashed line) and, the mass m and the semimajor axis r of the massive bodies (dot) at the noted time. The final panel also shows the massive bodies from the rest of the simulation set with each colour showing one of the five simulations.
Current usage metrics show cumulative count of Article Views (full-text article views including HTML views, PDF and ePub downloads, according to the available data) and Abstracts Views on Vision4Press platform.
Data correspond to usage on the plateform after 2015. The current usage metrics is available 48-96 hours after online publication and is updated daily on week days.
Initial download of the metrics may take a while.