Fig. 4.
Download original image
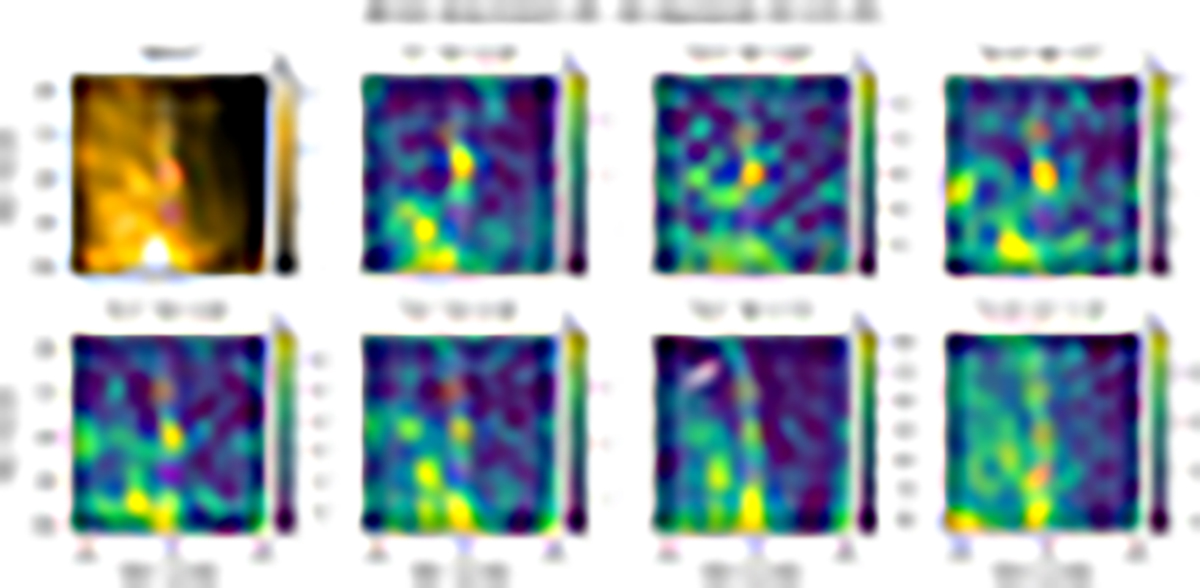
HRIEUV (top-left panel) and EIS images centred around the event E10, on 2023 April 4 (S3). The HRIEUV image is taken at the time closest to that of the EIS slit position indicated by dashed white lines. The event region (red), along with the background regions 1 (orange) and 2 (purple) are displayed as rectangles. These regions are defined in Sect. 3.1.2. The temperature log T of the maximum emissivity of each line is indicated inside parenthesis on top of the image. The white arrow in the Fe XI image indicates the large coronal loop standing above E10.
Current usage metrics show cumulative count of Article Views (full-text article views including HTML views, PDF and ePub downloads, according to the available data) and Abstracts Views on Vision4Press platform.
Data correspond to usage on the plateform after 2015. The current usage metrics is available 48-96 hours after online publication and is updated daily on week days.
Initial download of the metrics may take a while.