Fig. C.2.
Download original image
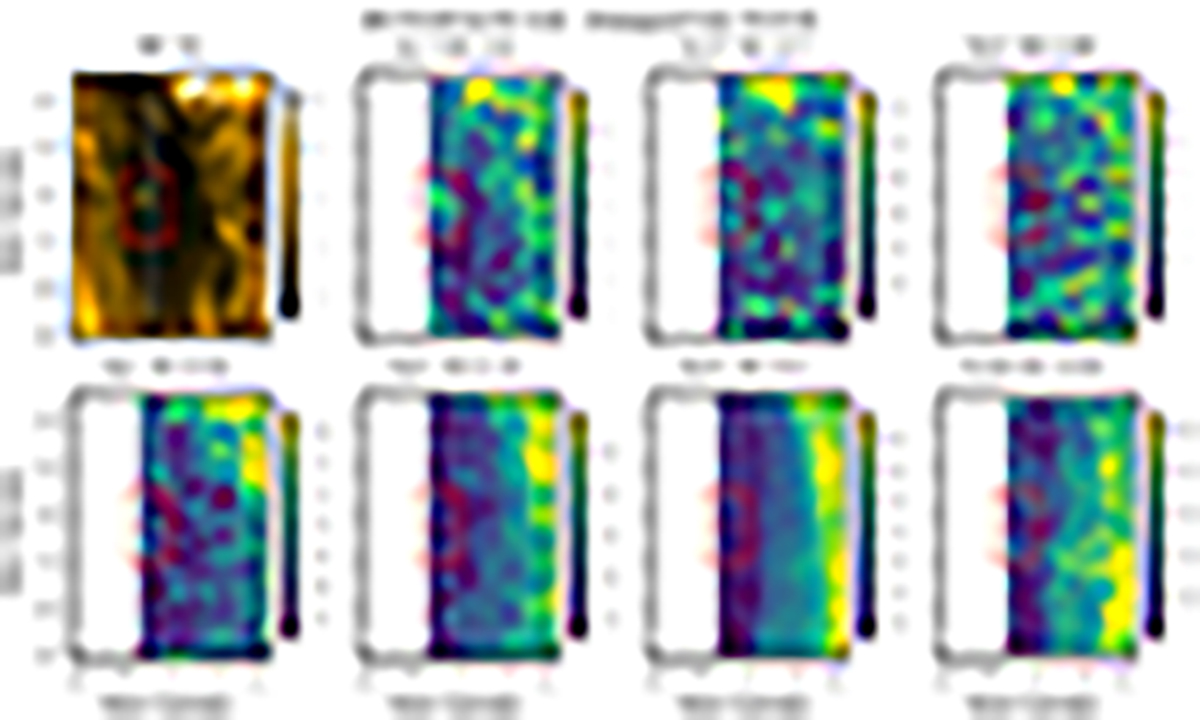
Images of HRIEUV and EIS centred around E11, visible in the He II 256 Å line. The white dotted lines show the position of the slit at 06:34:41 UTC, and the red rectangle is an area centred around E11. The temperatures (log T) of the peak emissivity are indicated within parentheses for each line.
Current usage metrics show cumulative count of Article Views (full-text article views including HTML views, PDF and ePub downloads, according to the available data) and Abstracts Views on Vision4Press platform.
Data correspond to usage on the plateform after 2015. The current usage metrics is available 48-96 hours after online publication and is updated daily on week days.
Initial download of the metrics may take a while.