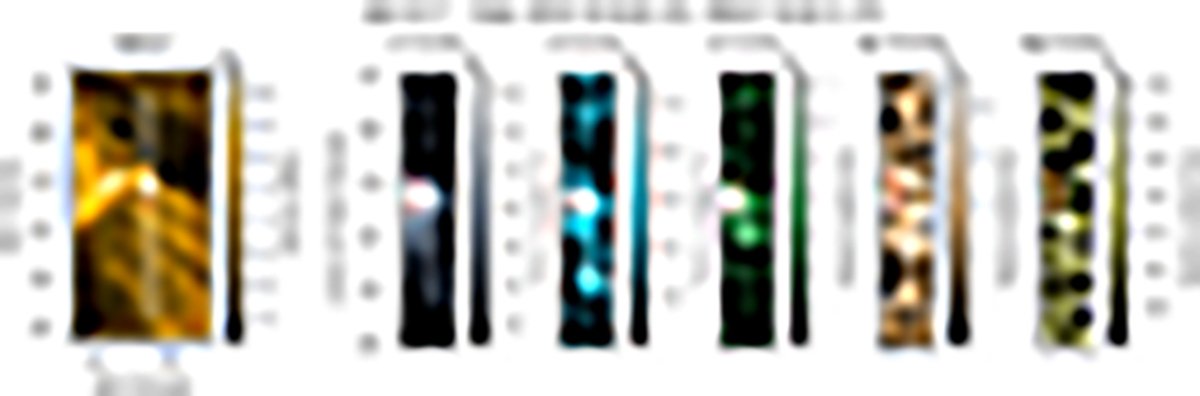
Fig. 2.
Download original image
Event detected on 2022 March 17 (S1), so-called E9. The HRIEUV (left panel) and the SPICE images are centred around E9. The HRIEUV image is taken at the acquisition time of the left-hand SPICE slit. The position of the slit is displayed as a dashed line on the HRIEUV and the SPICE images. The two white lines in HRIEUV delimit the field of view of the SPICE slit. The red rectangle is the event region, defined in Sect. 3.1.1. The temperature (log T) of the maximum emissivity of each SPICE line is indicated within parentheses above each image. The latitude on the y-axis of the SPICE images refers to the position of the slit marked with a white dashed line. A movie is available online.
Current usage metrics show cumulative count of Article Views (full-text article views including HTML views, PDF and ePub downloads, according to the available data) and Abstracts Views on Vision4Press platform.
Data correspond to usage on the plateform after 2015. The current usage metrics is available 48-96 hours after online publication and is updated daily on week days.
Initial download of the metrics may take a while.