Fig. B.6.
Download original image
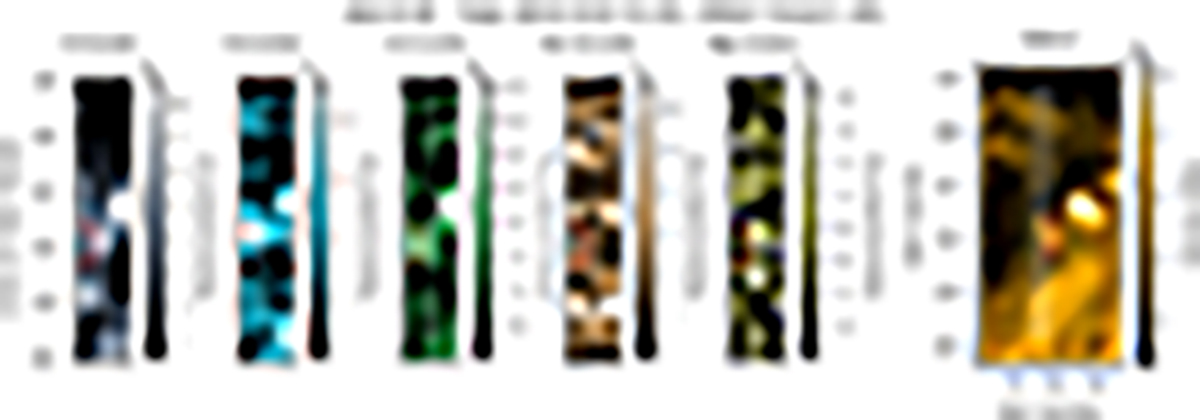
HRIEUV (left panel) and the SPICE images are centred around E5, at the time of its peak in HRIEUV intensity on S2. The position of the slit is displayed as a dashed line on the HRIEUV and the SPICE images. The two white lines in HRIEUV delimit the field of view of the SPICE slit. The red rectangle is the event region selected, and it is defined in Sect. 3.1.1. The temperature (log T) of the maximum emissivity of each SPICE line is indicated within parentheses above each image. The latitude on the y-axis of the SPICE images refers to the position of the slit marked with a white dashed line. The details of this figure are the same as in Fig. 2. A movie is available online.
Current usage metrics show cumulative count of Article Views (full-text article views including HTML views, PDF and ePub downloads, according to the available data) and Abstracts Views on Vision4Press platform.
Data correspond to usage on the plateform after 2015. The current usage metrics is available 48-96 hours after online publication and is updated daily on week days.
Initial download of the metrics may take a while.