Fig. B.3.
Download original image
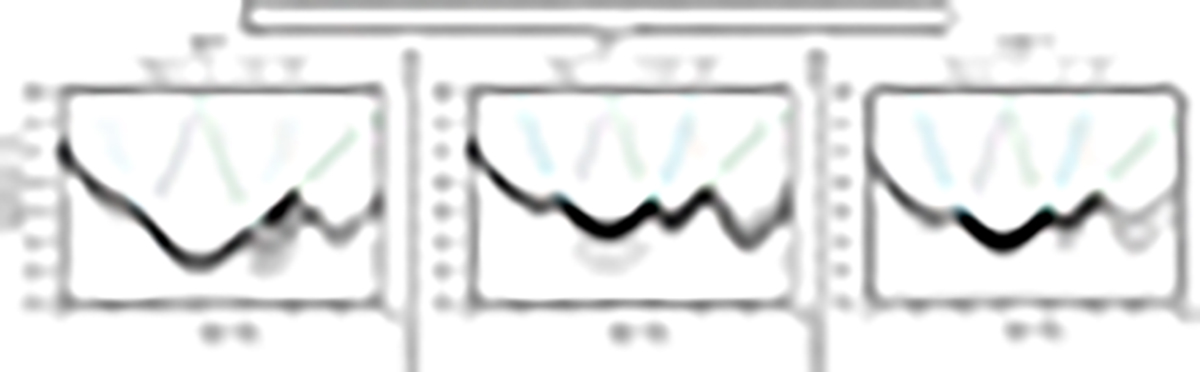
EM estimated with the LOCI method of E1 (a), E3 (b), and E4 (d) at the time of their HRIEUV peaks, using four SPICE lines. The EMs of the event are shown for each SPICE line with colored curves. Dotted curves indicate that the radiance is an upper limit. The black full curves display the EM for the event. The dotted and the dashed black lines are the EMs for the B1 and B2 background time intervals. B1 also includes upper limits in O IV for E2 and in Ne VIII for E4. The black (event) and grey (B1 and B2) regions delimit the 2σ uncertainty of the EMs. The details of this figure are the same as in Fig. 7.
Current usage metrics show cumulative count of Article Views (full-text article views including HTML views, PDF and ePub downloads, according to the available data) and Abstracts Views on Vision4Press platform.
Data correspond to usage on the plateform after 2015. The current usage metrics is available 48-96 hours after online publication and is updated daily on week days.
Initial download of the metrics may take a while.