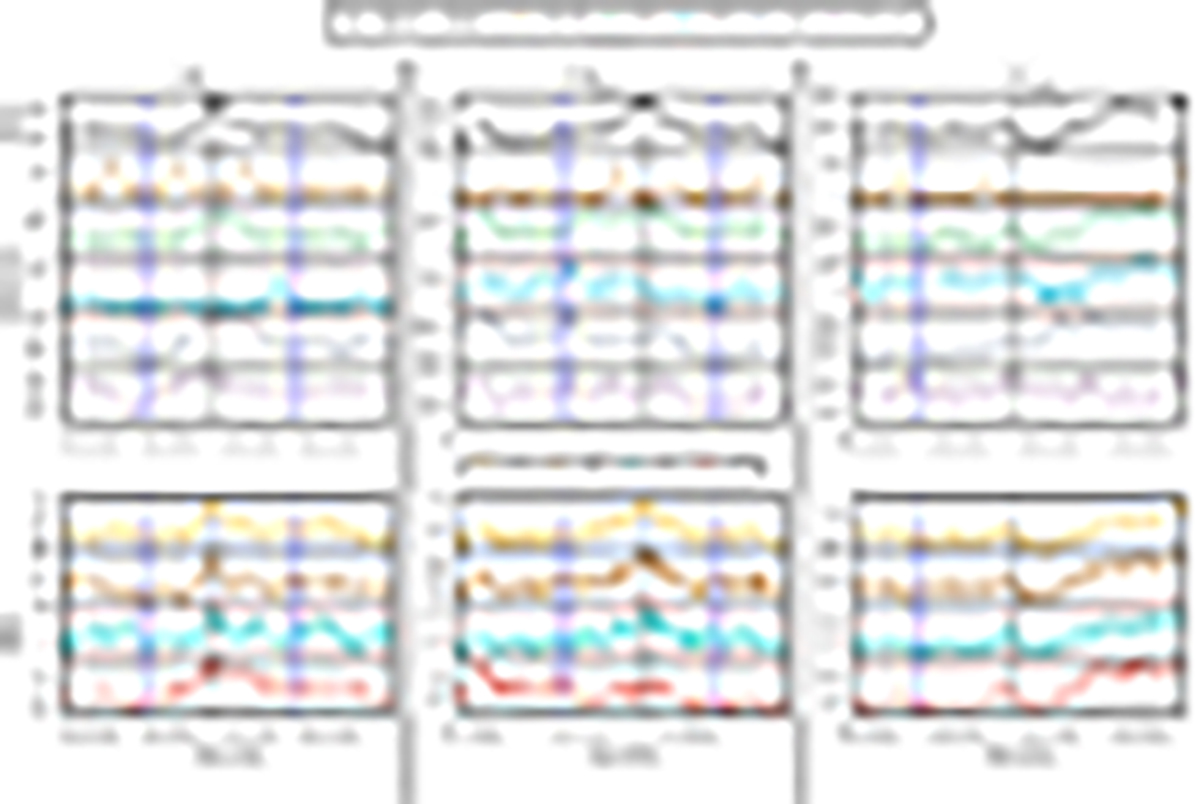
Fig. B.2.
Download original image
HRIEUV, SPICE, and AIA light curves for E1 (a), E3 (b), and E5 (c). The vertical black lines indicate the SPICE times closest to the HRIEUV peaks, when the EMs are estimated in Fig. B.3. The two background time intervals of two minutes, defined in Sect. 3.2.1, are represented by two vertical blue lines in each panel. The left blue line indicates the end of B1 (before the event), and the right blue line indicates the start of B2 (after the event). Here, E5 only includes B1, as it is before another larger event. The upper limits of the SPICE radiance are shown as horizontal dotted lines. When the line is not detected above noise levels, the radiance is being replaced by its upper limit, and the point is marked by a downward pointing arrow. The details of this figure are the same as in Fig. 6
Current usage metrics show cumulative count of Article Views (full-text article views including HTML views, PDF and ePub downloads, according to the available data) and Abstracts Views on Vision4Press platform.
Data correspond to usage on the plateform after 2015. The current usage metrics is available 48-96 hours after online publication and is updated daily on week days.
Initial download of the metrics may take a while.